Custom colormap
This example shows how to create and use a custom colormap.
# from `bindings/cython/examples/colormap.py`
import numpy as np
import numpy.random as nr
from datoviz import app, canvas, run, colormap
# Create the canvas, panel, and visual.
c = canvas(show_fps=True)
ctx = c.gpu().context()
panel = c.scene().panel(controller='panzoom')
visual = panel.visual('path', transform=None)
# Uniform parameters for the visual.
visual.data('linewidth', np.array([50]))
visual.data('cap_type', np.array([0]))
# Create a horizontal thick line.
n = 256
x = np.linspace(-1, 1, n)
y = np.zeros(n)
z = np.zeros(n)
pos = np.c_[x, y, z] # an (N, 3) array with the coordinates of the path vertices.
pos[:, 1] -= .25
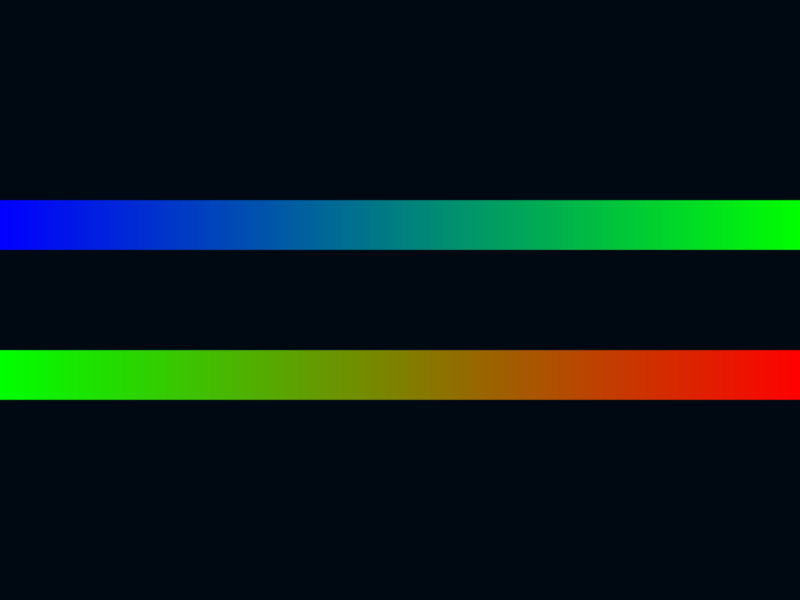
# Create a first custom color map, ranging from red to green.
cmap = np.c_[np.arange(256), np.arange(256)[::-1], np.zeros(256), 255 * np.ones(256)]
ctx.colormap('mycmap0', cmap.astype(np.uint8))
# Add a first line.
visual.data('pos', pos)
visual.data('color', colormap(np.linspace(0, 1, n), cmap='mycmap0'))
# Create a second custom color map, ranging from green to blue.
cmap = np.c_[np.zeros(256), np.arange(256), np.arange(256)[::-1], 255 * np.ones(256)]
ctx.colormap('mycmap1', cmap.astype(np.uint8))
# Add a second line.
pos[:, 1] += .5
# NOTE: note the use of the .append() method here, to concatenate the array to the existing data.
visual.append('pos', pos)
visual.append('color', colormap(np.linspace(0, 1, n), cmap='mycmap1'))
# Set the length of each path.
visual.data('length', np.array([n, n]))
# Start the event loop.
run()