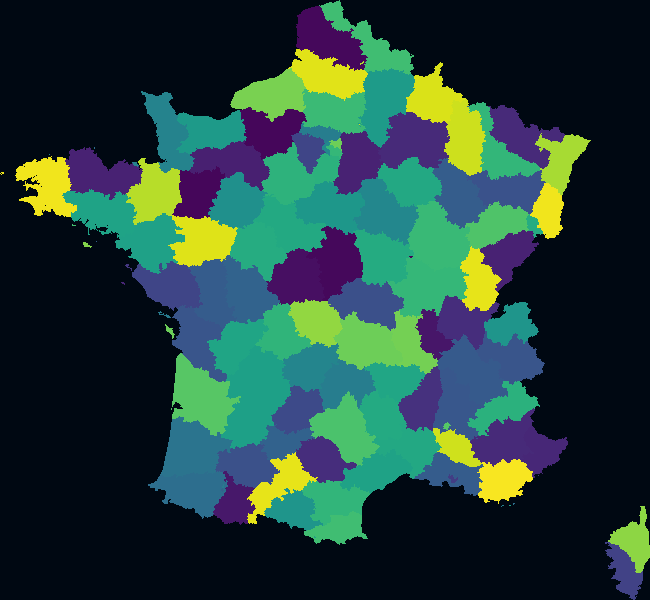
France departements
This example shows how to display many polygons with a single visual.
# from `bindings/cython/examples/france.py`

# Imports.
from pathlib import Path
import numpy as np
import numpy.random as nr
from datoviz import canvas, run, colormap

# Path to the root git directory so as to load the polygon data.
ROOT = Path(__file__).resolve().parent.parent.parent.parent

# The first file is a flat binary file with the 2D coordinates of all points.
pos = np.fromfile(
    ROOT / "data/misc/departements.polypoints.bin", dtype=np.float64)
pos = pos.reshape((-1, 2))
pos = np.c_[pos[:, 1], pos[:, 0], np.zeros(pos.shape[0])]
# latitude, longitude, 0

# We use a Web Mercator projection to convert from geographical coordinates to an
# Euclidean coordinate system.
# NOTE: a future version of Datoviz may provide a better method for non-linear
# data transformations.
lat, lon, _ = pos.T
lonrad = lon / 180.0 * np.pi
latrad = lat / 180.0 * np.pi
zoom = 1
c = 256 / 2 * np.pi * 2 ** zoom
x = c * (lonrad + np.pi)
y = -c * (np.pi - np.log(np.tan(np.pi / 4.0 + latrad / 2.0)))
pos = np.c_[x, y, _]

# The second file contains the length of each polygon.
length = np.fromfile(
    ROOT / "data/misc/departements.polylengths.bin", dtype=np.uint32)

# We make the polygon colors, with one value per polygon.
N = len(length)  # this is the number of polygons
color = colormap(nr.rand(N), vmin=0, vmax=1, cmap='viridis')

# We create a canvas, a scene, and a panel.
c = canvas(width=650, height=600, show_fps=False)
panel = c.scene().panel(controller='panzoom')

# We add a polygon visual.
visual = panel.visual('polygon')

# We pass the point positions, the colors, and crucially, the length of each polygon that
# is used for batch rendering.
visual.data('pos', pos)
visual.data('color', color)
visual.data('length', length)

# We run the vent loop.
run()