Datoviz: high-performance rendering for scientific data visualization
⚡️ Datoviz is an open-source, cross-platform, high-performance rendering library for scientific data visualization making extensive use of the graphics processing unit (GPU).
Up to 10,000x faster than matplotlib, it delivers highly efficient high-quality GPU rendering of 2D and 3D graphical primitives—markers, paths, images, text, meshes, volumes, and more—that scale to millions of elements. Datoviz also supports graphical user interfaces (GUIs) for interactive visualization.
Built from the ground up with performance in mind, Datoviz is written primarily in C and C++, leveraging the Khronos Vulkan graphics API. It offers a C API, low-level Python bindings via ctypes, and a higher-level, idiomatic Python API 🐍.
Written by one of the original creators of VisPy, a GPU-based Python scientific visualization library, Datoviz aims to serve as the default backend for the upcoming VisPy 2.0.
The library is lightweight with minimal dependencies: mostly Vulkan, GLFW for windowing, and Dear ImGui for GUIs.
Warning
Datoviz is a young library. The API is stabilizing, but breaking changes may still occur as the project evolves with broader usage.
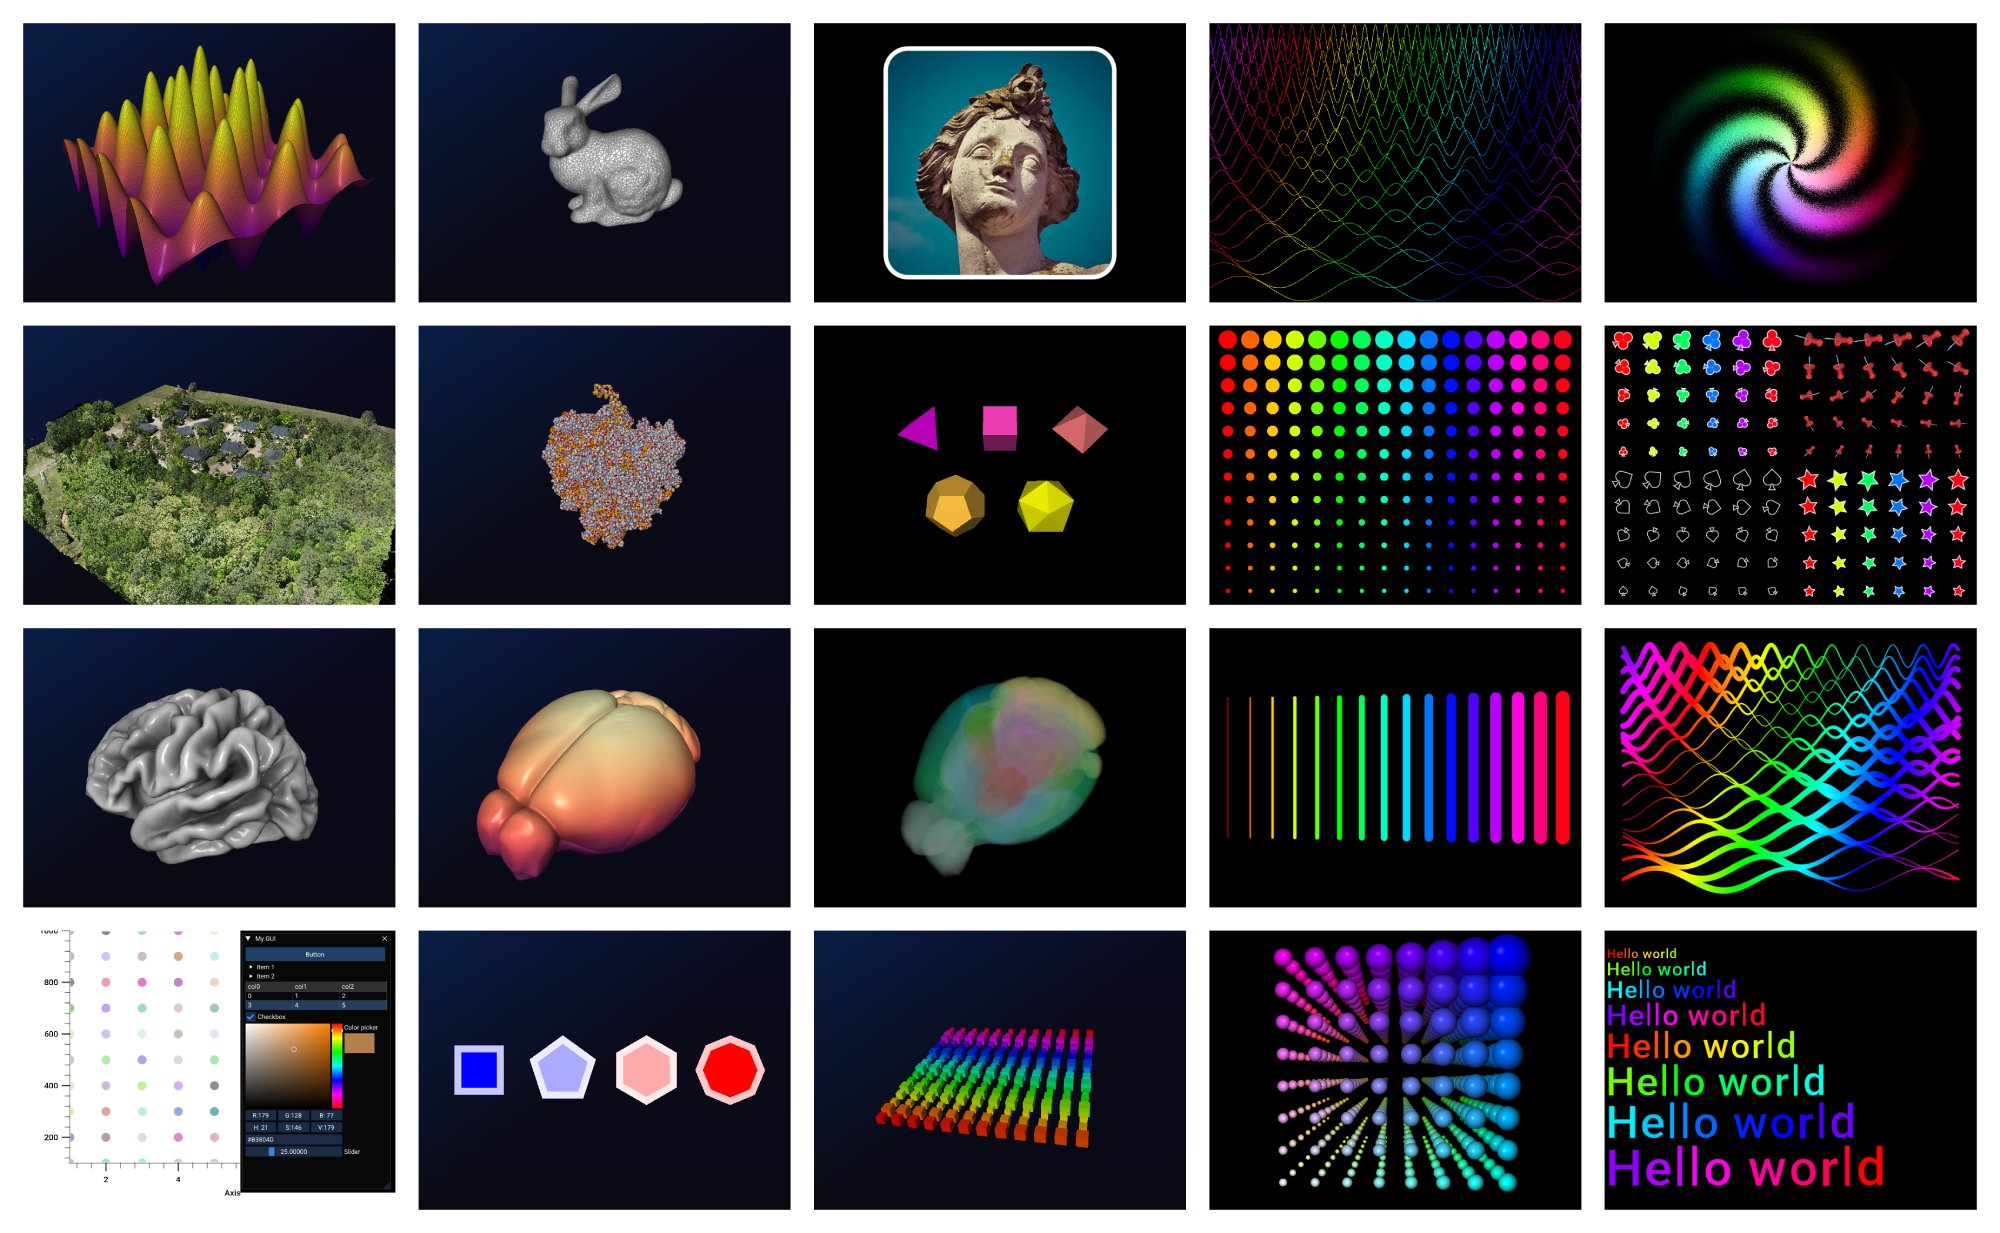
✨ Current features
- 📊 2D visuals: antialiased points, markers, line segments, paths, text, images
- 📈 2D axes
- 🌐 3D visuals: meshes, volumes, volume slices
- 🌈 150 colormaps included (from matplotlib, colorcet, MATLAB)
- 🖱️ High-level interactivity: pan & zoom for 2D, arcball for 3D (more later)
- 🎥 Manual control of cameras: custom interactivity
- 𓈈 Figure subplots (aka "panels")
- 🖥️ GUIs using Dear ImGui
🧩 API philosophy
Datoviz does not use high-level plotting functions like plot(), scatter(), or imshow(). Instead, it exposes flexible visual primitives—markers, images, meshes, and more—that can be added to a scene and customized directly with data. This approach offers fine-grained control and high performance, while remaining concise enough for quick plots.
A higher-level plotting interface is under development as part of VisPy 2.0, which will use Datoviz as its rendering backend. An intermediate layer called GSP (Graphics Specification Protocol) will provide a backend-agnostic API for declarative plotting.
🔍 Comparison with other libraries
🐍 Matplotlib
Matplotlib is the gold standard for static, publication-quality figures, with a mature, feature-rich API. But it's not optimized for interactivity or large datasets.
Datoviz, in contrast, is a younger, GPU-based library designed for fast, interactive visualization. It lacks Matplotlib’s high-level API but excels at rendering millions of points in real time.
Use Matplotlib for polished static plots, Datoviz for responsive data exploration.
Preliminary performance benchmark
The figure below shows a preliminary performance benchmark comparing Datoviz and Matplotlib on an interactive 2D scatter plot, with increasing numbers of points and a simulated zoom interaction:
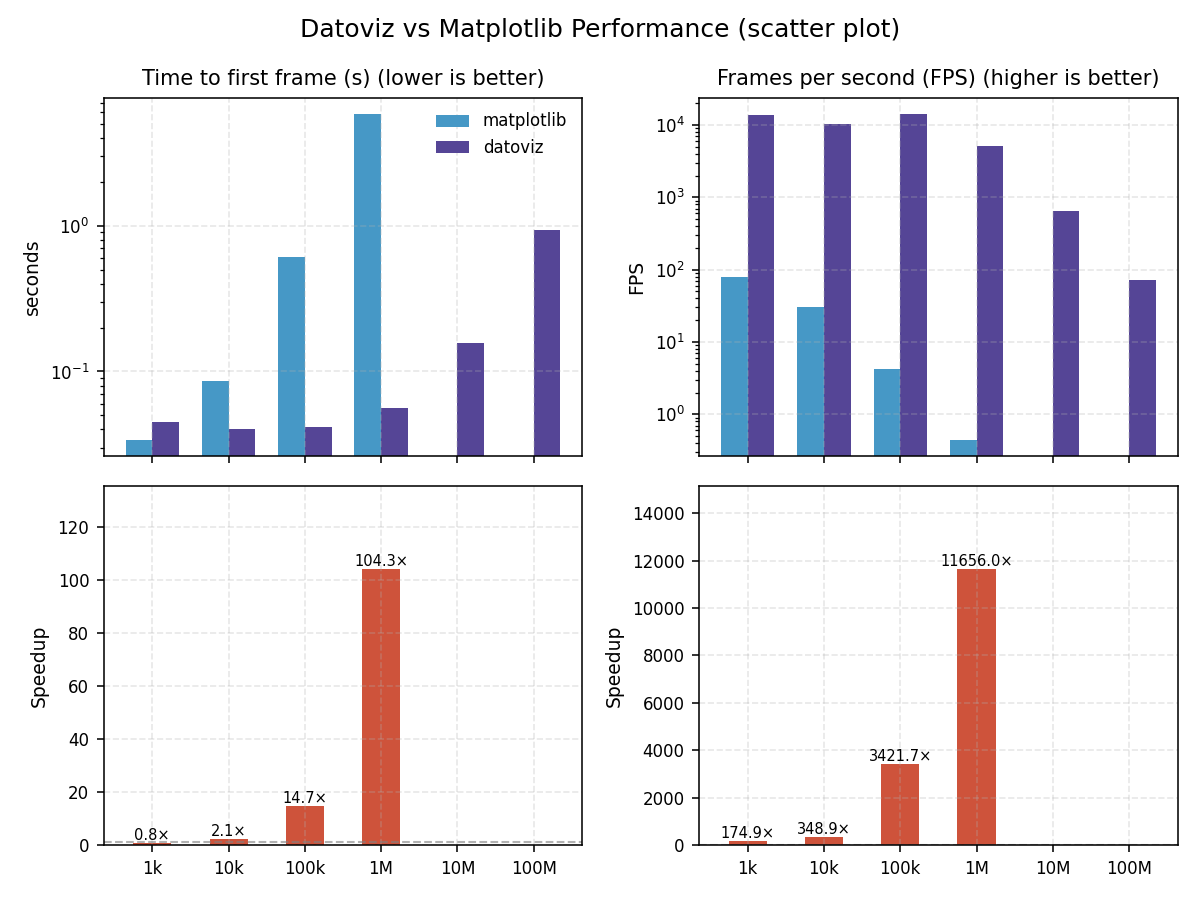
In this benchmark, Datoviz outperforms Matplotlib by a factor of up to 10,000×, maintaining interactive framerates even with millions of points. Matplotlib, in contrast, becomes sluggish or fails entirely as the dataset size increases.
🧊 VTK
Datoviz is lighter, simpler, and easier to install than VTK. It compiles in seconds, has minimal dependencies, and focuses exclusively on real-time rendering of visual primitives. Unlike VTK, it does not include data file I/O (except minimal test loaders like .obj), computational geometry, or data processing.
VTK is a powerful, heavyweight toolkit for 3D visualization, simulation, and scientific computing workflows. In contrast, Datoviz is designed for fast, high-quality 2D and 3D rendering.
🚀 Get started
- 👉 Quickstart guide — create your first scatter plot in a few lines of code
- 📚 Learn — deep dive into visuals, layout, interactivity, and more
- 🖼️ Gallery — curated examples of what Datoviz can render
- 🧩 API Reference — full Python and C documentation
🛠️ Installation
Datoviz runs out of the box on all major platforms:
- ✅ Windows, macOS (Intel and Apple Silicon), and Linux
- ✅ Prebuilt wheels for 64-bit architectures (x86_64 and arm64)
- ✅ No system dependencies — just install and run
Install the Python package via pip:
pip install datoviz
To use the C library directly, see the build instructions.
📄 License
Datoviz is open source and licensed under the MIT License.