Datoviz — GPU visualization for large scientific data
Datoviz is an open-source, cross-platform visualization engine written in C, with direct Python/NumPy bindings. It uses Vulkan to render large, dynamic datasets in interactive, high-quality 2D and 3D scenes on Linux, macOS, and Windows.
Datoviz is desktop-first, with native windows, offscreen rendering, application embedding, and built-in GUI support through Dear ImGui. An experimental WebGPU/WASM subset brings selected scenes to the browser.
v0.4.0rc2: the active release candidate is published on PyPI and GitHub, including the packaged macOS native-window repair. The native Vulkan scene API is the primary supported path; browser WebGPU and advanced/unstable facilities remain experimental. See the RC2 release notes, feature status, or the legacy v0.3 documentation.
What can you build?
Datoviz combines scientific visuals, interaction, annotation, and native application controls in the same retained scene model.

Textured planets
Textured worlds, a star field, orbital debris, and 3D navigation.
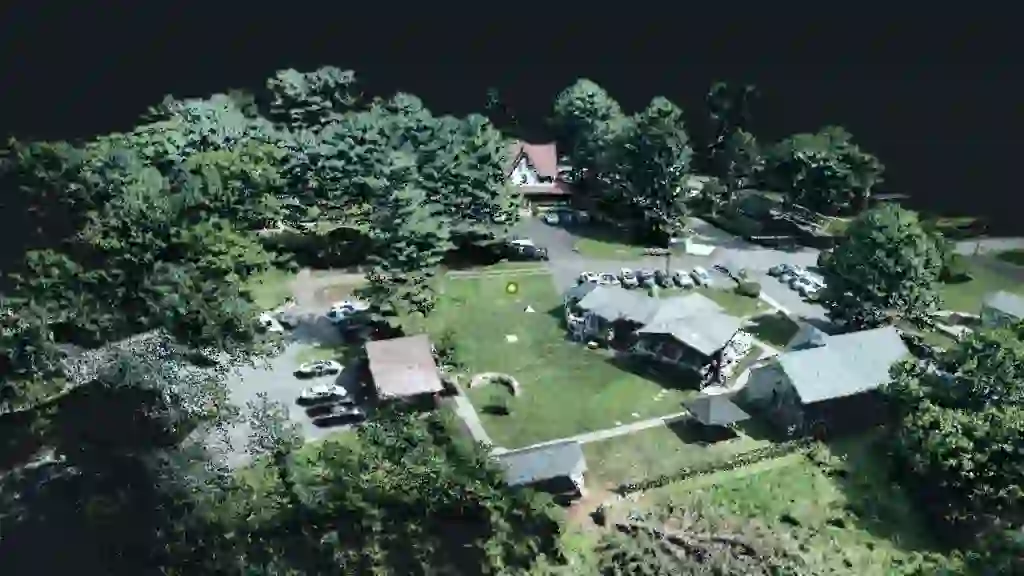
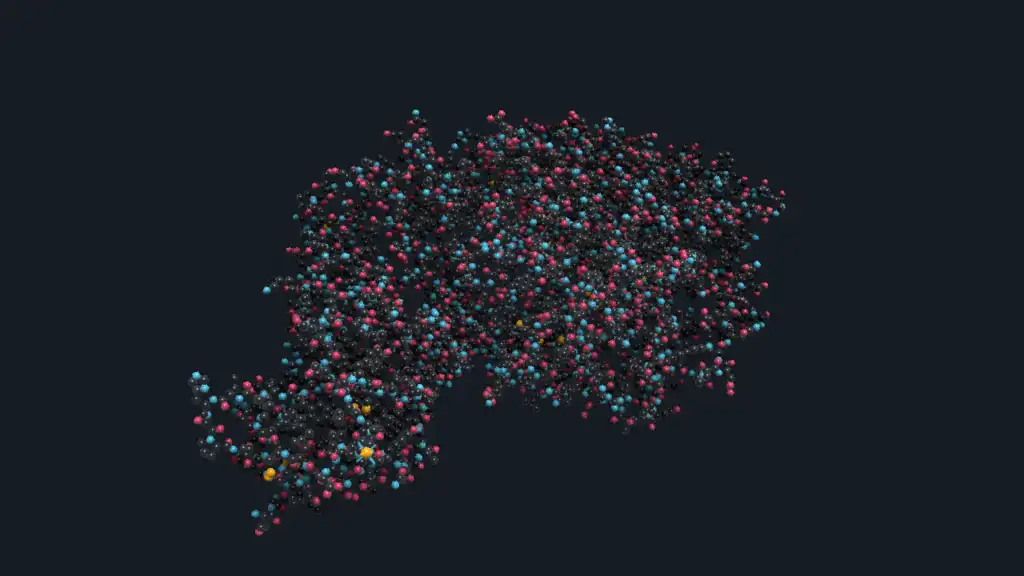
Point cloud
Large colorized LiDAR data with fly navigation and depth enhancement.
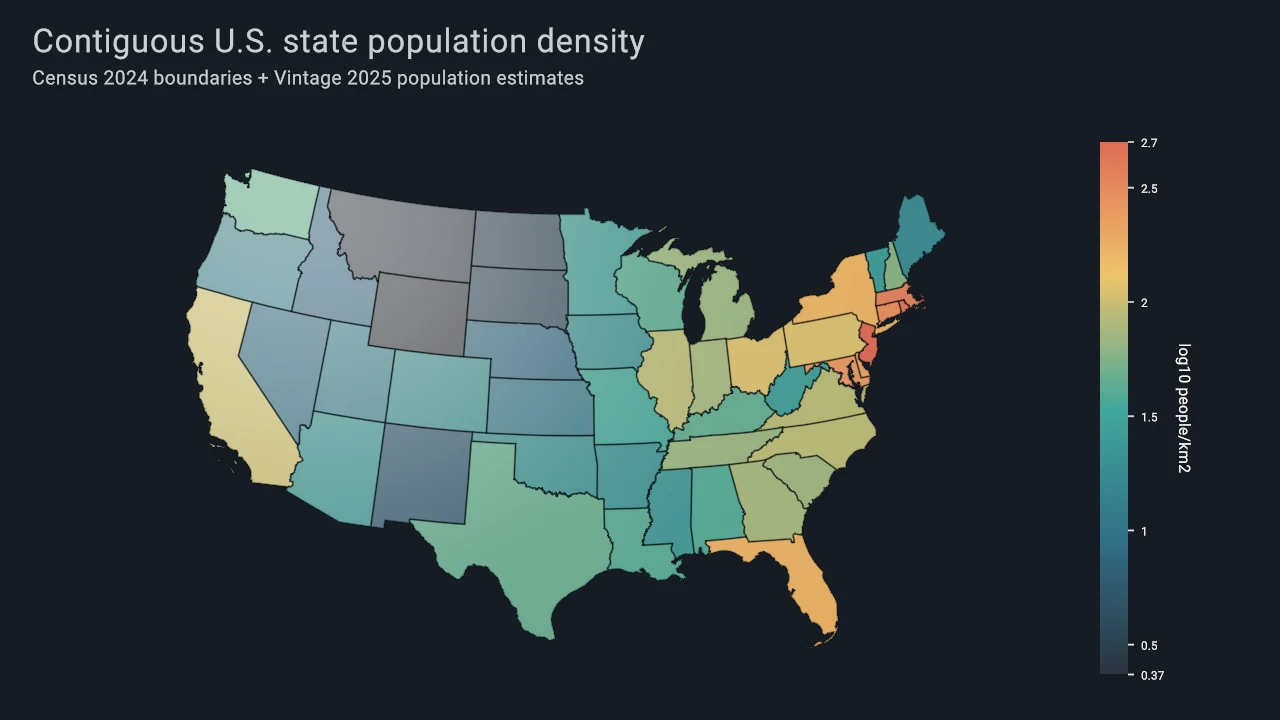
U.S. state choropleth
Population density mapped across contiguous U.S. state polygons.
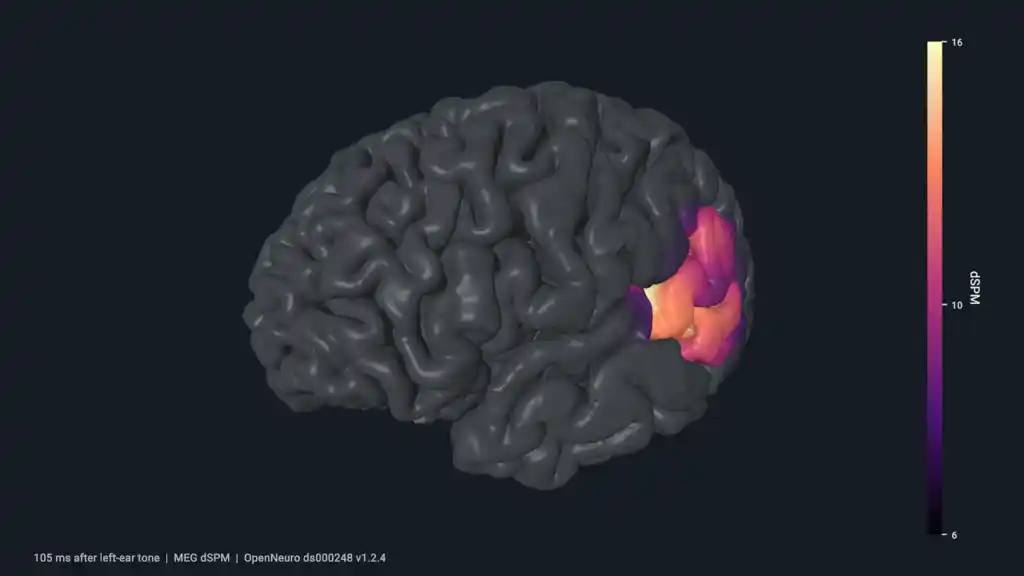
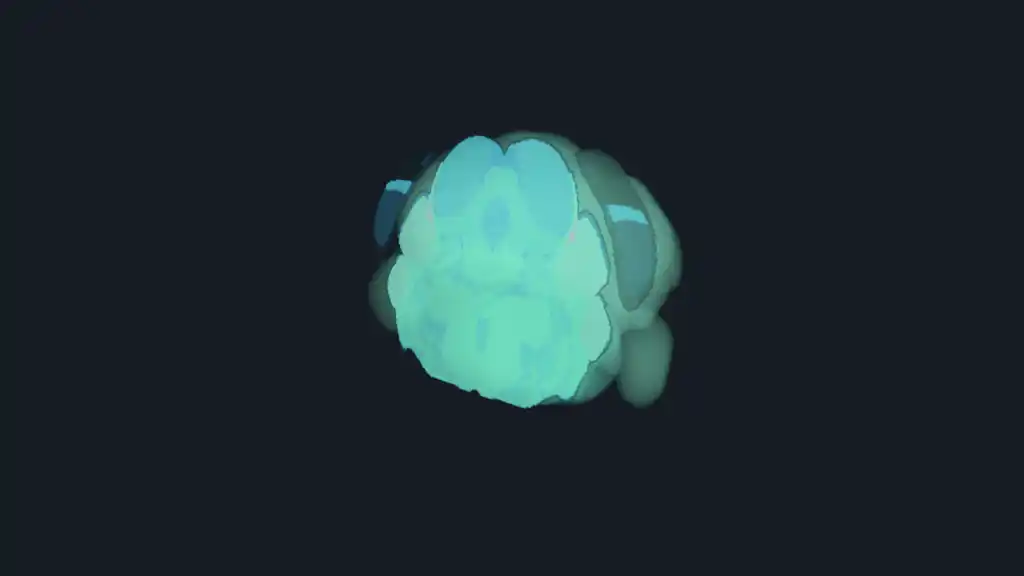
Human cortical activity
Time-varying MEG activity projected onto a rotating cortical surface.
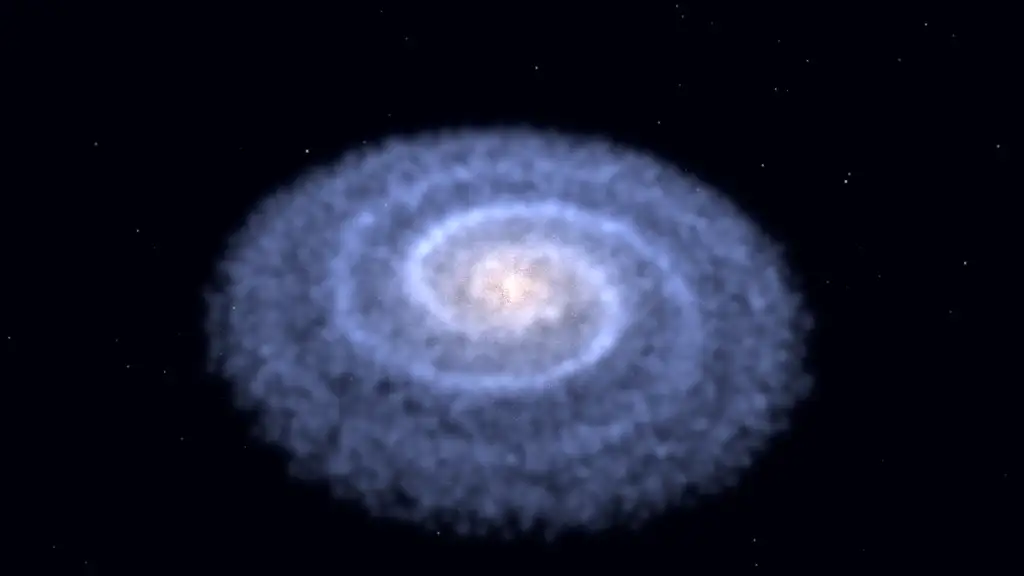
Density-wave galaxy
An animated spiral galaxy built from a density-wave particle model.

GPU particle smoke
Compute-driven particles rendered through native compute and graphics interop.
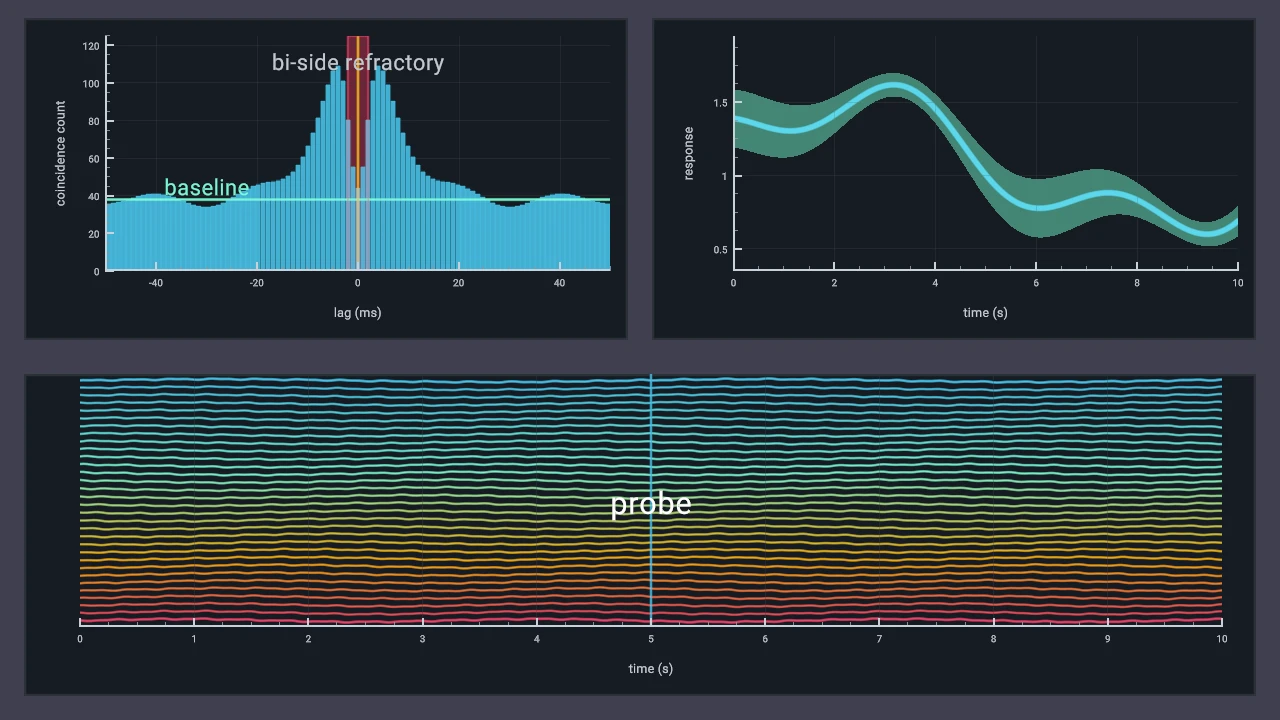
Scientific Plotting Workflow
Histograms, uncertainty bands, stacked traces, axes, and annotations.
Allen mouse brain
An anatomical RGBA volume with slices and structure meshes.
Start with your language
Python + NumPy
Create retained scenes and pass NumPy arrays directly to Datoviz functions. The API keeps the
same explicit dvz_* vocabulary as C.
C or C++
Use the native C library for desktop applications, embedding, offscreen rendering, capture, and lower-level runtime integration. The public API uses C linkage and is callable from C++.
Prebuilt wheels containing the Python binding and native runtime are published and validated for supported Linux, macOS, and Windows targets. Install the exact release candidate with python -m pip install --pre datoviz==0.4.0rc2, then follow the installation instructions.
Built for scientific applications
Large, dynamic data
Update points, images, sampled fields, meshes, volumes, text, and annotations without rebuilding the entire scene.
First-class 2D and 3D
Compose axes, panels, paths, images, and guides alongside cameras, lighting, meshes, point clouds, and volumes.
Interaction and composition
Combine linked panels, panzoom and 3D controllers, picking, queries, labels, colorbars, and native GUI controls.
Native integration and output
Render in windows or offscreen, embed the C engine, capture screenshots, export video, and record or replay render streams.
Where Datoviz fits
Datoviz v0.4 is an explicit rendering engine, not a Matplotlib-like plotting frontend. Most users work with retained figures, panels, visuals, and controllers; experienced integrators can use the protocol and runtime layers directly.
- High-level plotting Developing GSP and VisPy 2 interfaces outside Datoviz v0.4 — use the scene API below today
- Retained scene API Figures, panels, visuals, controllers, annotations, and queries
- Datoviz Rendering Protocol v2 (DRP2) Backend-neutral, WebGPU-shaped command streams, validation, and replay
- Rendering runtimes Native Vulkan execution and the experimental browser WebGPU subset
Source builds expose switches for compatible core, Vulkan, canvas, DRP2, scene, app, and GUI components. The native WebGPU build option is separate from the browser WebGPU/WASM toolchain. See Choose your layer and Build options.
Platform and maturity
| Surface | v0.4 position |
|---|---|
| Native Vulkan scene API | Supported Primary path, with feature-specific status documented separately |
| Linux, macOS, and Windows | Supported targets Wheel and source-build requirements vary by platform |
| Python | Supported Direct generated binding with documented NumPy adaptation |
| Dear ImGui | Supported Built-in native desktop GUI support |
| WebGPU/WASM | Experimental Browser subset for promoted examples, not native feature parity |
| DRP2 and lower-level runtime APIs | Advanced/unstable Integration surfaces |
Review Platform support, Feature status, and Project status before adopting an experimental or backend-specific feature.
Continue
For human-led coding-assistant guidance, see the AI-assisted workflow. For autonomous code generation, use the stricter AI-agent contract. Project acknowledgements are recorded in the repository credits.