Examples
- Basic visual example
- GUI example
- Image example
- Mesh example
- Path offscreen example
- Panels example
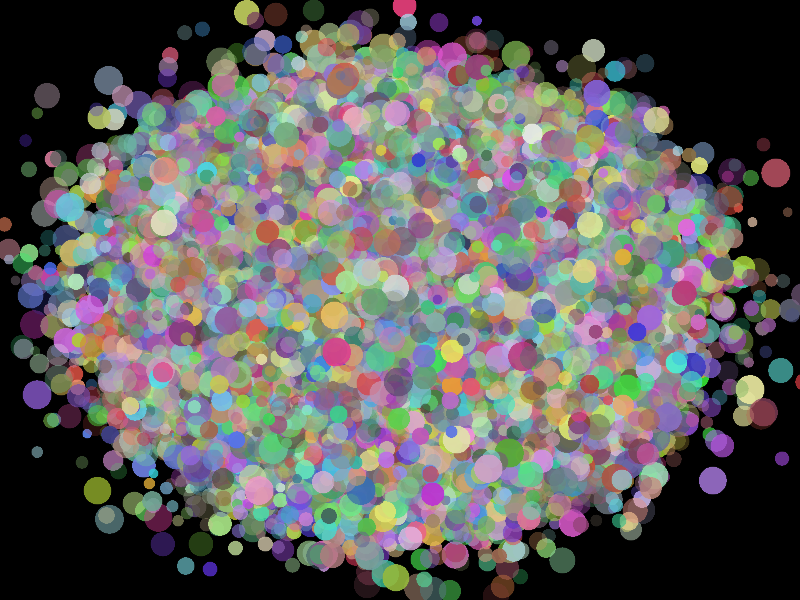
- Scatter plot example
- Spheres example
- Surface example
- Volume example
- Datoviz Rendering Protocol (DRP) example
Basic visual example
Show a colored triangle using a basic visual.
Illustrates:
- Creating a figure, panel
- Basic visual
- Vertex color interpolation

👨💻 Expand the code from examples/basic.py
import numpy as np
import datoviz as dvz

# Boilerplate.
app = dvz.app(0)
batch = dvz.app_batch(app)
scene = dvz.scene(batch)

# Create a figure 800x600.
figure = dvz.figure(scene, 800, 600, 0)

# Panel spanning the entire window.
panel = dvz.panel_default(figure)

# Basic visual.
visual = dvz.basic(batch, dvz.PRIMITIVE_TOPOLOGY_TRIANGLE_LIST, 0)

# Visual data allocation.
dvz.basic_alloc(visual, 3)

# Positions.
pos = np.array([
    [-1, -1, 0],
    [0, 1, 0],
    [+1, -1, 0],
]).astype(np.float32)
dvz.basic_position(visual, 0, 3, pos, 0)

# Colors.
color = np.array(
    [[255, 0, 0, 255],
     [0, 255, 0, 255],
     [0, 0, 255, 255],
     ]).astype(np.uint8)
dvz.basic_color(visual, 0, 3, color, 0)

# Add the visual.
dvz.panel_visual(panel, visual, 0)

# Run the application.
dvz.scene_run(scene, app, 0)

# Cleanup.
dvz.scene_destroy(scene)
dvz.app_destroy(app)
GUI example
Display a simple GUI to control the size of a mesh.
Illustrates:
- Creating a figure, panel
- Panzoom interactivity
- Shape
- Mesh visual and shape mesh
- GUI callback
- GUI dialog
- GUI buttons
- Shape transforms
- Dynamic shape and mesh update
Note: the screenshot does not show the GUI at the moment, this will be fixed soon.

👨💻 Expand the code from examples/gui.py
import numpy as np
import datoviz as dvz
from datoviz import (
    S_,  # Python string to ctypes char*
    vec2,
    vec3,
    vec4,
)


# GUI callback function.
@dvz.gui
def ongui(app, fid, ev):
    # Set the size of the next GUI dialog.
    dvz.gui_size(vec2(170, 110))

    # Start a GUI dialog with a dialog title.
    dvz.gui_begin(S_("My GUI"), 0)

    # Add two buttons. The functions return whether the button was pressed.
    incr = dvz.gui_button(S_("Increase"), 150, 30)
    decr = dvz.gui_button(S_("Decrease"), 150, 30)

    # Scaling factor.
    scale = 1.0
    if incr:
        scale = 1.1
    elif decr:
        scale = 0.9
    if incr or decr:

        # Start recording shape transforms for all vertices in the shape (first=0, count=0=all).
        dvz.shape_begin(shape, 0, 0)

        # Scaling transform.
        dvz.shape_scale(shape, vec3(scale, scale, scale))

        # Stop recording the shape transforms.
        dvz.shape_end(shape)

        # Update the mesh visual data with the new shape's data.
        dvz.mesh_reshape(visual, shape)

    # End the GUI dialog.
    dvz.gui_end()


# Boilerplate.
app = dvz.app(0)
batch = dvz.app_batch(app)
scene = dvz.scene(batch)

# Create a figure.
# NOTE: to use a GUI, use this flag. Don't use it if there is no GUI.
figure = dvz.figure(scene, 800, 800, dvz.CANVAS_FLAGS_IMGUI)
panel = dvz.panel_default(figure)
arcball = dvz.panel_arcball(panel)

# Cube colors.
colors = np.array([
    [255, 0, 0, 255],
    [0, 255, 0, 255],
    [0, 0, 255, 255],
    [255, 255, 0, 255],
    [255, 0, 255, 255],
    [0, 255, 255, 255],
], dtype=np.uint8)
shape = dvz.shape_cube(colors)

# Create a mesh visual directly instantiated with the shape data.
visual = dvz.mesh_shape(batch, shape, dvz.MESH_FLAGS_LIGHTING)

# Add the visual to the panel.
dvz.panel_visual(panel, visual, 0)

# Associate a GUI callback function with a figure.
dvz.app_gui(app, dvz.figure_id(figure), ongui, None)

# Initial arcball angles.
dvz.arcball_initial(arcball, vec3(+0.6, -1.2, +3.0))
dvz.panel_update(panel)

# Run the application.
dvz.scene_run(scene, app, 0)

# Cleanup.
dvz.shape_destroy(shape)
dvz.scene_destroy(scene)
dvz.app_destroy(app)
Image example
Show an image.
Illustrates:
- Creating a figure, panel
- Panzoom interactivity
- Loading a PNG image with pillow
- Image visual
- Creating a texture

👨💻 Expand the code from examples/image.py
from pathlib import Path
import numpy as np
from PIL import Image

import datoviz as dvz
from datoviz import A_

# Boilerplate.
app = dvz.app(0)
batch = dvz.app_batch(app)
scene = dvz.scene(batch)


# Load a PNG image.
CURDIR = Path(__file__).parent
filepath = CURDIR / "../data/textures/image.png"
with Image.open(filepath) as f:
    image = np.array(f.convert('RGBA'), dtype=np.uint8)
    height, width = image.shape[:2]

    # Texture parameters.
    format = dvz.FORMAT_R8G8B8A8_UNORM
    address_mode = dvz.SAMPLER_ADDRESS_MODE_CLAMP_TO_BORDER
    filter = dvz.FILTER_LINEAR

    # Create a texture out of a RGB image.
    tex = dvz.tex_image(batch, format, width, height, A_(image))


# Create a figure 1000x1000.
figure = dvz.figure(scene, 1000, 1000, 0)

# Panel spanning the entire window.
panel = dvz.panel_default(figure)

# Panzoom interactivity.
pz = dvz.panel_panzoom(panel)

# Image visual.
visual = dvz.image(batch, dvz.IMAGE_FLAGS_RESCALE)

# One image in this visual, there could be multiple images sharing the same underlying texture.
dvz.image_alloc(visual, 1)

# xyz coordinates of the top left corner.
pos = np.array([[0, 0, 0]], dtype=np.float32)
dvz.image_position(visual, 0, 1, pos, 0)

# Image size, in pixels.
size = np.array([[width, height]], dtype=np.float32)
dvz.image_size(visual, 0, 1, size, 0)

# Image anchor.
anchor = np.array([[.5, .5]], dtype=np.float32)
dvz.image_anchor(visual, 0, 1, anchor, 0)

# uv coordinates of the top left corner, and bottom right corner.
texcoords = np.array([[0, 0, 1, 1]], dtype=np.float32)
dvz.image_texcoords(visual, 0, 1, texcoords, 0)


# Assign the texture to the visual.
dvz.image_texture(visual, tex, filter, address_mode)

# Add the visual.
dvz.panel_visual(panel, visual, 0)

# Run the application.
dvz.scene_run(scene, app, 0)

# Cleanup.
dvz.scene_destroy(scene)
dvz.app_destroy(app)
Mesh example
Show a 3D mesh.
Illustrates:
- Creating a figure, panel
- Arcball interactivity
- Loading a .OBJ mesh file
- 3D shape
- Mesh visual and shape mesh
- Colormaps
- Manual mesh colors
- Timer events
- Dynamic visual updates

👨💻 Expand the code from examples/mesh.py
from pathlib import Path
import numpy as np
import datoviz as dvz
from datoviz import vec3, vec4, S_

# Boilerplate.
app = dvz.app(0)
batch = dvz.app_batch(app)
scene = dvz.scene(batch)

# Create a figure 800x600.
figure = dvz.figure(scene, 800, 600, 0)

# Panel spanning the entire window.
panel = dvz.panel_default(figure)

# Arcball interactivity.
arcball = dvz.panel_arcball(panel)

# Load a .OBJ mesh file.
CURDIR = Path(__file__).parent
filepath = (CURDIR / "../data/mesh/brain.obj").resolve()
shape = dvz.shape_obj(S_(filepath))

# Fill artificial colors.
nv = shape.vertex_count
ni = shape.index_count
print(f"Loaded {filepath} with {nv} vertices and {ni // 3} faces.")

# Create the mesh visual from the surface shape.
flags = dvz.MESH_FLAGS_LIGHTING
visual = dvz.mesh_shape(batch, shape, flags)

# Set artificial vertex colors.
t = np.linspace(0, 1, nv).astype(np.float32)
colors = np.empty((nv, 4), dtype=np.uint8)
dvz.colormap_array(dvz.CMAP_COOLWARM, nv, t, 0, 1, colors)
dvz.mesh_color(visual, 0, nv, colors, 0)

# Add the visual to the panel.
dvz.panel_visual(panel, visual, 0)

# Initial arcball angles.
dvz.arcball_initial(arcball, vec3(+0.6, -1.2, +3.0))
dvz.panel_update(panel)


# Timer callback: update the arcball angles in real time.
@dvz.timer
def _on_timer(app, window_id, ev):
    a = 20 * (ev.time % 1)
    u = 1 / (1 + np.exp(-a * (t - 0.5)))

    dvz.colormap_array(dvz.CMAP_COOLWARM, nv, u.astype(np.float32), 0, 1, colors)
    dvz.mesh_color(visual, 0, nv, colors, 0)


# Create a timer (60 events per second).
dvz.app_timer(app, 0, 1. / 60., 0)

# Register a timer callback.
dvz.app_ontimer(app, _on_timer, None)


# Run the application.
dvz.scene_run(scene, app, 0)

# Cleanup.
dvz.scene_destroy(scene)
dvz.app_destroy(app)
Path offscreen example
This path example illustrates how to generate an offscreen image and save it as a PNG.
Illustrates:
- Creating a figure, panel
- Panzoom interactivity
- Path visual
- Offscreen rendering (save to a PNG image)

👨💻 Expand the code from examples/offscreen.py
import numpy as np
import datoviz as dvz
from datoviz import (
    S_,  # Python string to ctypes char*
)

offscreen = True

# Boilerplate.
app = dvz.app(dvz.APP_FLAGS_OFFSCREEN if offscreen else 0)
batch = dvz.app_batch(app)
scene = dvz.scene(batch)

# Create a figure.
figure = dvz.figure(scene, 400, 800, 0)
panel = dvz.panel_default(figure)

# Panzoom interactivity.
pz = dvz.panel_panzoom(panel)

# Path visual.
visual = dvz.path(batch, 0)

# Multiple paths.
n_paths = 100
path_size = 1000
n = n_paths * path_size
path_lengths = np.full(n_paths, path_size, dtype=np.uint32)
dvz.path_alloc(visual, n)

# Positions.
x = np.linspace(-1, +1, path_size)
x = np.tile(x, (n_paths, 1))
w = np.random.uniform(size=(n_paths, 1), low=20, high=100)
d = 0.5 / (n_paths - 1)
y = d * np.sin(w * x)
y += np.linspace(-1, 1, n_paths).reshape((-1, 1))
z = np.zeros((n_paths, path_size))
pos = np.c_[x.flat, y.flat, z.flat].astype(np.float32)
dvz.path_position(visual, n, pos, n_paths, path_lengths, 0)

# Colors.
t = np.linspace(0, 1, n_paths).astype(np.float32)
color = np.full((n_paths, 4), 255, dtype=np.uint8)
dvz.colormap_array(dvz.CMAP_HSV, n_paths, t, 0, 1, color)
color = np.repeat(color, path_size, axis=0)
dvz.path_color(visual, 0, n, color, 0)

# Line width.
dvz.path_linewidth(visual, 3.0)

# Add the visual.
dvz.panel_visual(panel, visual, 0)

# Run the application.
dvz.scene_run(scene, app, 0)

# Screenshot to ./offscreen.png.
if offscreen:
    dvz.app_screenshot(app, dvz.figure_id(figure), S_("offscreen_python.png"))

# Cleanup.
dvz.scene_destroy(scene)
dvz.app_destroy(app)
Panels example
Show visuals in two different panels.
Illustrates:
- Creating a figure, panel
- Point visual
- Marker visual
- Multiple panels
- Mixing 2D and 3D in the same window
- GUI checkbox
- Show/hide a visual

👨💻 Expand the code from examples/panels.py
import ctypes
import numpy as np
import datoviz as dvz
from datoviz import vec2, vec3, S_, V_


# -------------------------------------------------------------------------------------------------
# 1. Creating the scene
# -------------------------------------------------------------------------------------------------

# Boilerplate.
app = dvz.app(0)
batch = dvz.app_batch(app)
scene = dvz.scene(batch)

# Create a figure 800x600.
w, h = 800, 600
figure = dvz.figure(scene, w, h, dvz.CANVAS_FLAGS_IMGUI)


# -------------------------------------------------------------------------------------------------
# 2. First visual
# -------------------------------------------------------------------------------------------------

# Point visual.
visual0 = dvz.point(batch, 0)

# Visual data allocation.
n = 10_000
dvz.point_alloc(visual0, n)

# Point positions.
pos = np.random.normal(size=(n, 3), scale=.25).astype(np.float32)
dvz.point_position(visual0, 0, n, pos, 0)

# Point colors.
color = np.random.uniform(size=(n, 4), low=50, high=240).astype(np.uint8)
color[:, 3] = 240
dvz.point_color(visual0, 0, n, color, 0)

# Point sizes.
size = np.random.uniform(size=(n,), low=10, high=30).astype(np.float32)
dvz.point_size(visual0, 0, n, size, 0)

dvz.visual_depth(visual0, dvz.DEPTH_TEST_ENABLE)


# -------------------------------------------------------------------------------------------------
# 3. Second visual
# -------------------------------------------------------------------------------------------------

# Point visual.
visual1 = dvz.marker(batch, 0)

# Visual data allocation.
n = 1_000
dvz.marker_alloc(visual1, n)

# Marker positions.
pos = np.random.normal(size=(n, 3), scale=.25).astype(np.float32)
dvz.marker_position(visual1, 0, n, pos, 0)

# Marker colors.
color = np.random.uniform(size=(n, 4), low=50, high=240).astype(np.uint8)
color[:, 3] = 240
dvz.marker_color(visual1, 0, n, color, 0)

# Marker sizes.
size = np.random.uniform(size=(n,), low=30, high=60).astype(np.float32)
dvz.marker_size(visual1, 0, n, size, 0)

# Marker parameters.
dvz.marker_aspect(visual1, dvz.MARKER_ASPECT_OUTLINE)
dvz.marker_shape(visual1, dvz.MARKER_SHAPE_CROSS)
# dvz.marker_edge_color(visual1, cvec4(255, 255, 255, 255))
# dvz.marker_edge_width(visual1, 3.0)


# -------------------------------------------------------------------------------------------------
# 4. Panels
# -------------------------------------------------------------------------------------------------

# Panels.
panel0 = dvz.panel(figure, 0, 0, w / 2, h)
panel1 = dvz.panel(figure, w / 2, 0, w / 2, h)

dvz.panel_arcball(panel0)
dvz.panel_panzoom(panel1)

dvz.panel_visual(panel0, visual0, 0)
dvz.panel_visual(panel1, visual1, 0)


# -------------------------------------------------------------------------------------------------
# 5. GUI with checkbox
# -------------------------------------------------------------------------------------------------

# There are four steps to add a GUI with a checkbox.
# i.    Initialize the figure with the flag `dvz.CANVAS_FLAGS_IMGUI``
# ii.   Define a global-scoped object representing the variable to be updated by the GUI.
# iii.  Define the GUI callback.
# iv.   Call `dvz.app_gui(...)`

# A wrapped boolean value with initial value False.
checked = V_(True, ctypes.c_bool)


@dvz.gui
def ongui(app, fid, ev):
    """GUI callback function."""

    # Set the size of the next GUI dialog.
    dvz.gui_size(vec2(170, 110))

    # Start a GUI dialog with a dialog title.
    dvz.gui_begin(S_("My GUI"), 0)

    # Add a checkbox
    with checked:  # Wrap the boolean value.
        # Return True if the checkbox's state has changed.
        if dvz.gui_checkbox(S_("Show visual"), checked.P_):
            #                                  ^^^^^^^^^^ pass a C pointer to our wrapped bool
            is_checked = checked.value  # Python variable with the checkbox's state

            # Show/hide the visual.
            dvz.visual_show(visual0, is_checked)

            # Update the figure after its composition has changed.
            dvz.figure_update(figure)

    # End the GUI dialog.
    dvz.gui_end()


# Associate a GUI callback function with a figure.
dvz.app_gui(app, dvz.figure_id(figure), ongui, None)


# -------------------------------------------------------------------------------------------------
# 6. Run and cleanup
# -------------------------------------------------------------------------------------------------

# Run the application.
dvz.scene_run(scene, app, 0)

# Cleanup.
dvz.scene_destroy(scene)
dvz.app_destroy(app)
Scatter plot example
Show points in 2D with various colors and sizes.
Illustrates:
- Creating a figure, panel
- Panzoom interactivity
- Point visual
👨💻 Expand the code from examples/scatter.py
import numpy as np
import datoviz as dvz

# Boilerplate.
app = dvz.app(0)
batch = dvz.app_batch(app)
scene = dvz.scene(batch)

# Create a figure 800x600.
figure = dvz.figure(scene, 800, 600, 0)

# Panel spanning the entire window.
panel = dvz.panel_default(figure)

# Panzoom interactivity.
pz = dvz.panel_panzoom(panel)

# Point visual.
visual = dvz.point(batch, 0)

# Visual data allocation.
n = 100_000
dvz.point_alloc(visual, n)

# Point positions.
pos = np.random.normal(size=(n, 3), scale=.25).astype(np.float32)
dvz.point_position(visual, 0, n, pos, 0)

# Point colors.
color = np.random.uniform(size=(n, 4), low=50, high=240).astype(np.uint8)
dvz.point_color(visual, 0, n, color, 0)

# Point sizes.
size = np.random.uniform(size=(n,), low=10, high=30).astype(np.float32)
dvz.point_size(visual, 0, n, size, 0)

# Add the visual.
dvz.panel_visual(panel, visual, 0)

# Run the application.
dvz.scene_run(scene, app, 0)

# Cleanup.
dvz.scene_destroy(scene)
dvz.app_destroy(app)
Spheres example
Show fake 3D spheres and static text with manual camera control.
Illustrates:
- Adding multiple visuals to a panel
- Sphere visual
- Glyph (text) visual
- Dynamic and static visual (visual opting out of the global panel transform)
- Keyboard event callbacks
- Manual camera control

👨💻 Expand the code from examples/spheres.py
import numpy as np
import datoviz as dvz
from datoviz import vec2, vec3, vec4, S_


# -------------------------------------------------------------------------------------------------
# 1. Creating the scene
# -------------------------------------------------------------------------------------------------

# Boilerplate.
app = dvz.app(0)
batch = dvz.app_batch(app)
scene = dvz.scene(batch)

# Create a figure.
figure = dvz.figure(scene, 1000, 1000, 0)

# Panel spanning the entire window.
panel = dvz.panel_default(figure)

# 3D camera.
camera = dvz.panel_camera(panel, 0)


# -------------------------------------------------------------------------------------------------
# 2. Text
# -------------------------------------------------------------------------------------------------

# Show a static glyph.
glyph = dvz.glyph(batch, 0)

# First, we load the default font (Roboto) with a given font size, and we load the pre-generated
# glyph atlas.
# NOTE: generating custom atlases dynamically with arbitrary TTF fonts (using the msdfgen library)
# is possible but undocumented yet.
font_size = 32
af = dvz.atlas_font(font_size)
dvz.glyph_atlas(glyph, af.atlas)

# Glyph text.
text = "Press the arrow keys!"

# We specify the number of glyphs.
n = len(text)
dvz.glyph_alloc(glyph, n)

# When displaying a single string, all glyph share the exact same position in 3D space, BUT
# each glyph has a fixed pixel offset due to its relative position within the string (see below).
# Here, the string will be displayed at (1, 1, 0) (we will not use the panel camera transform).
pos = np.c_[np.ones(n), np.ones(n), np.zeros(n)].astype(np.float32)
dvz.glyph_position(glyph, 0, n, pos, 0)

# We can assign a different color per glyph.
color = np.full((n, 4), 255, dtype=np.uint8)
dvz.glyph_color(glyph, 0, n, color, 0)

# We specify the ASCII string (we could also specify unicode uint32 codepoints with glyph_unicode)
# NOTE: we need to use S_() to pass a Python string to this ctypes-wrapped C function expecting
# a const char*.
dvz.glyph_ascii(glyph, S_(text))

# Now we compute the glyph shifts (called "xywh") using our font.
xywh = dvz.font_ascii(af.font, S_(text))
# We also define a global relative anchor point, in pixels (xy), for the string.
# By default, the anchor is (0, 0) which represents the lower left corner of the string. The
# anchor position is the string position defined above (1, 1, 0).
anchor = vec2(-.5 * font_size * len(text), -2 * font_size)
dvz.glyph_xywh(glyph, 0, n, xywh, anchor, 0)


# -------------------------------------------------------------------------------------------------
# 3. Spheres
# -------------------------------------------------------------------------------------------------

# Now we define a fake sphere visual, similar to markers, but with a fake 3D effect to simulate
# spheres whereas they are really 2D bitmap sprites in a 3D world.
# See https://paroj.github.io/gltut/Illumination/Tutorial%2013.html
visual = dvz.sphere(batch, 0)

# Sphere data allocation (100 000 spheres).
n = 100_000
dvz.sphere_alloc(visual, n)

# Sphere random positions.
pos = np.random.uniform(size=(n, 3), low=-1, high=+1).astype(np.float32)
pos *= np.array([100, 1, 100])
dvz.sphere_position(visual, 0, n, pos, 0)

# Sphere random colors.
color = np.random.uniform(size=(n, 4), low=50, high=200).astype(np.uint8)
color[:, 3] = 255
dvz.sphere_color(visual, 0, n, color, 0)

# Sphere sizes in pixels.
size = np.random.uniform(size=(n,), low=50, high=100).astype(np.float32)
dvz.sphere_size(visual, 0, n, size, 0)

# Light position.
dvz.sphere_light_pos(visual, vec3(-5, +5, +100))

# Light parameters.
dvz.sphere_light_params(visual, vec4(.4, .8, 2, 32))


# -------------------------------------------------------------------------------------------------
# 4. Panel composition
# -------------------------------------------------------------------------------------------------

# We add the sphere visual.
dvz.panel_visual(panel, visual, 0)

# We add the glyph visual and we opt out of the panel transform (3D movable camera).
dvz.panel_visual(panel, glyph, dvz.VIEW_FLAGS_STATIC)


# -------------------------------------------------------------------------------------------------
# 5. Manual camera control
# -------------------------------------------------------------------------------------------------

# Custom camera manipulation with the keyboard.
# NOTE: a similar interaction pattern will be soon provided as a builtin option in Datoviz
# (similar to the existing panzoom and arcball).

# Initial camera position.
eye = vec3(0, 0, 4)

# Camera movement offset.
d = .2


# Keyboard event callback function.
@dvz.keyboard
def on_keyboard(app, window_id, ev):
    global eye
    # Keyboard events are PRESS, RELEASE, and REPEAT.
    if ev.type != dvz.KEYBOARD_EVENT_RELEASE:
        # Move the camera position depending on the pressed keys.
        if ev.key == dvz.KEY_UP:
            eye[2] -= d
        elif ev.key == dvz.KEY_DOWN:
            eye[2] += d
        elif ev.key == dvz.KEY_LEFT:
            eye[0] -= d
        elif ev.key == dvz.KEY_RIGHT:
            eye[0] += d

        # Update the camera position.
        dvz.camera_position(camera, eye)

        # Update the lookat position (just forward looking).
        lookat = vec3(*eye)
        lookat[2] -= 1
        dvz.camera_lookat(camera, lookat)

        # Important: we must update the panel after the panel transformation parameters
        # have changed.
        dvz.panel_update(panel)


# We register the keyboard callback function.
dvz.app_onkeyboard(app, on_keyboard, None)


# -------------------------------------------------------------------------------------------------
# 6. Run and cleanup
# -------------------------------------------------------------------------------------------------

# Run the application.
dvz.scene_run(scene, app, 0)

# Cleanup.
dvz.atlas_destroy(af.atlas)
dvz.font_destroy(af.font)
dvz.scene_destroy(scene)
dvz.app_destroy(app)
Surface example
Show a rotating surface in 3D.
Illustrates:
- White background
- Surface shape
- Mesh visual and surface mesh
- Arcball interactivity
- Initial arcball angles
- Manual arcball parameter update
- Timers and timer callbacks

👨💻 Expand the code from examples/surface.py
import numpy as np
import datoviz as dvz
from datoviz import vec3, vec4

# Boilerplate.
app = dvz.app(dvz.APP_FLAGS_WHITE_BACKGROUND)
batch = dvz.app_batch(app)
scene = dvz.scene(batch)

# Create a figure 800x600.
figure = dvz.figure(scene, 800, 600, 0)

# Panel spanning the entire window.
panel = dvz.panel_default(figure)

# Arcball interactivity.
arcball = dvz.panel_arcball(panel)

# Grid parameters.
row_count = 250
col_count = row_count
n = row_count * col_count
o = vec3(-1, 0, -1)
u = vec3(0, 0, 2.0 / (col_count - 1))
v = vec3(2.0 / (row_count - 1), 0, 0)

# Allocate heights and colors arrays.
grid = np.meshgrid(row_count, col_count)
shape = (row_count, col_count)
heights = np.zeros(shape, dtype=np.float32)

# Create grid of coordinates
x = np.arange(col_count)
y = np.arange(row_count)
xv, yv = np.meshgrid(x, y)

# Distances.
center_x = col_count / 2
center_y = row_count / 2
d = np.sqrt((xv - center_x) ** 2 + (yv - center_y) ** 2)

# Heights.
a = 4.0 * 2 * np.pi / row_count
b = 3.0 * 2 * np.pi / col_count
c = .5
hmin = -.5
hmax = +.5
heights = np.exp(-.0001 * d ** 2) * np.sin(a*xv) * np.cos(b*yv)
heights = heights.ravel().astype(np.float32)

# Colors.
colors = np.empty((n, 4), dtype=np.uint8)
dvz.colormap_array(
    dvz.CMAP_PLASMA, n, heights, hmin, hmax, colors)

# Create the surface shape.
shape = dvz.shape_surface(row_count, col_count, heights, colors, o, u, v, 0)

# Create the mesh visual from the surface shape.
flags = dvz.MESH_FLAGS_LIGHTING
visual = dvz.mesh_shape(batch, shape, flags)

# Add the visual to the panel.
dvz.panel_visual(panel, visual, 0)

# Initial arcball angles.
angle = -0.39686
dvz.arcball_initial(arcball, vec3(0.42339, angle, -0.00554))
dvz.panel_update(panel)


# Timer callback: update the arcball angles in real time.
@dvz.timer
def _on_timer(app, window_id, ev):
    global angle
    angle += .01
    dvz.arcball_set(arcball, vec3(0.42339, angle, -0.00554))
    dvz.panel_update(panel)


# Create a timer (60 events per second).
dvz.app_timer(app, 0, 1. / 60., 0)

# Register a timer callback.
dvz.app_ontimer(app, _on_timer, None)

# Run the application.
dvz.scene_run(scene, app, 0)

# Cleanup.
dvz.scene_destroy(scene)
dvz.app_destroy(app)
Volume example
Show a 3D volume.
Illustrates:
- Creating a figure, panel
- Arcball interactivity
- Loading a volume from file
- Creating a 3D texture
- Volume visual

👨💻 Expand the code from examples/volume.py
import gzip
from pathlib import Path
import numpy as np
import datoviz as dvz
from datoviz import A_, vec3, vec4


# -------------------------------------------------------------------------------------------------
# 1. Creating the scene
# -------------------------------------------------------------------------------------------------

# Boilerplate.
app = dvz.app(0)
batch = dvz.app_batch(app)
scene = dvz.scene(batch)

# Create a figure 800x600.
figure = dvz.figure(scene, 800, 600, 0)

# Panel spanning the entire window.
panel = dvz.panel_default(figure)

# Arcball interactivity.
arcball = dvz.panel_arcball(panel)


# -------------------------------------------------------------------------------------------------
# 2. Loading the volume and creating the 3D GPU texture
# -------------------------------------------------------------------------------------------------

# Load a volume file.
CURDIR = Path(__file__).parent
filepath = (CURDIR / "../data/volumes/allen_mouse_brain_rgba.npy.gz").resolve()
with gzip.open(filepath, 'rb') as f:
    volume_data = np.load(f)
shape = volume_data.shape

# Volume parameters.
MOUSE_D, MOUSE_H, MOUSE_W = shape[:3]
scaling = 1.0 / MOUSE_D

# Create the 3D texture.
format = dvz.FORMAT_R8G8B8A8_UNORM
tex = dvz.tex_volume(batch, format, MOUSE_W, MOUSE_H, MOUSE_D, A_(volume_data))


# -------------------------------------------------------------------------------------------------
# 3. Volume visual
# -------------------------------------------------------------------------------------------------

# Create the volume visual.
visual = dvz.volume(batch, dvz.VOLUME_FLAGS_RGBA)

# Visual data allocation (1 volumetric object).
dvz.volume_alloc(visual, 1)

# Bind the volume texture to the visual.
volume_tex = dvz.volume_texture(
    visual, tex, dvz.FILTER_LINEAR, dvz.SAMPLER_ADDRESS_MODE_CLAMP_TO_EDGE)

# Volume parameters.
dvz.volume_size(visual, MOUSE_W * scaling, MOUSE_H * scaling, 1)
dvz.volume_transfer(visual, vec4(1, 0, 0, 0))


# Add the visual to the panel AFTER setting the visual's data.
dvz.panel_visual(panel, visual, 0)


# -------------------------------------------------------------------------------------------------
# 4. Initial panel parameters
# -------------------------------------------------------------------------------------------------

# Initial arcball angles.
dvz.arcball_initial(arcball, vec3(-2.25, 0.65, 1.5))

# Initial camera position.
camera = dvz.panel_camera(panel, 0)
dvz.camera_initial(camera, vec3(0, 0, 1.5), vec3(), vec3(0, 1, 0))

# Update the panel after updating the arcball and camera.
dvz.panel_update(panel)


# -------------------------------------------------------------------------------------------------
# 5. Run and cleanup
# -------------------------------------------------------------------------------------------------

# Run the application.
dvz.scene_run(scene, app, 0)

# Cleanup.
dvz.scene_destroy(scene)
dvz.app_destroy(app)
Datoviz Rendering Protocol (DRP) example
Show a simple triangle using raw DRP requests.
Illustrates:
- Using the DRP API

👨💻 Expand the code from examples/drp.py
import numpy as np
import datoviz as dvz

app = dvz.app(0)
batch = dvz.app_batch(app)

# Constants.
width = 1024
height = 768

# Define the Vertex dtype
vertex_dtype = np.dtype([
    ('pos', np.float32, (3,)),  # 3D position (vec3)
    ('color', np.uint8, (4,))   # RGBA color (cvec4)
])
vertex_size = vertex_dtype.itemsize
pos_offset = vertex_dtype.fields['pos'][1]
color_offset = vertex_dtype.fields['color'][1]


# Create a canvas.
req = dvz.create_canvas(batch, width, height, dvz.DEFAULT_CLEAR_COLOR, 0)
canvas_id = req.id


# Create a custom graphics.
req = dvz.create_graphics(batch, dvz.GRAPHICS_CUSTOM, 0)
graphics_id = req.id


# Vertex shader.
vertex_glsl = """
#version 450

layout(location = 0) in vec3 pos;
layout(location = 1) in vec4 color;
layout(location = 0) out vec4 out_color;

void main()
{
    gl_Position = vec4(pos, 1.0);
    out_color = color;
}
"""

req = dvz.create_glsl(
    batch, dvz.SHADER_VERTEX, dvz.S_(vertex_glsl))

# Assign the shader to the graphics pipe.
vertex_id = req.id
dvz.set_shader(batch, graphics_id, vertex_id)


# Fragment shader.
fragment_glsl = """
#version 450

layout(location = 0) in vec4 in_color;
layout(location = 0) out vec4 out_color;

void main()
{
    out_color = in_color;
}
"""

req = dvz.create_glsl(
    batch, dvz.SHADER_FRAGMENT, dvz.S_(fragment_glsl))

# Assign the shader to the graphics pipe.
fragment_id = req.id
dvz.set_shader(batch, graphics_id, fragment_id)


# Primitive topology.
dvz.set_primitive(batch, graphics_id, dvz.PRIMITIVE_TOPOLOGY_TRIANGLE_LIST)

# Polygon mode.
dvz.set_polygon(batch, graphics_id, dvz.POLYGON_MODE_FILL)


# Vertex binding.
dvz.set_vertex(
    batch, graphics_id, 0, vertex_size, dvz.VERTEX_INPUT_RATE_VERTEX)

# Vertex attrs.
dvz.set_attr(batch, graphics_id, 0, 0, dvz.FORMAT_R32G32B32_SFLOAT, pos_offset)
dvz.set_attr(batch, graphics_id, 0, 1, dvz.FORMAT_R8G8B8A8_UNORM, color_offset)


# Create the vertex buffer dat.
req = dvz.create_dat(batch, dvz.BUFFER_TYPE_VERTEX, 3 * vertex_size, 0)
dat_id = req.id

# Bind the vertex buffer dat to the graphics pipe.
req = dvz.bind_vertex(batch, graphics_id, 0, dat_id, 0)

# Upload the triangle data.
data = np.array([
    ((-1, +1, 0), (255, 0, 0, 255)),
    ((+1, +1, 0), (0, 255, 0, 255)),
    ((+0, -1, 0), (0, 0, 255, 255)),
], dtype=vertex_dtype)
req = dvz.upload_dat(batch, dat_id, 0, 3 * vertex_size, dvz.A_(data), 0)


# Commands.
dvz.record_begin(batch, canvas_id)
dvz.record_viewport(
    batch, canvas_id, dvz.DEFAULT_VIEWPORT, dvz.DEFAULT_VIEWPORT)
dvz.record_draw(batch, canvas_id, graphics_id, 0, 3, 0, 1)
dvz.record_end(batch, canvas_id)


# Run the application.

# NOTE: disabling this example for now as the current stable version of Datoviz is NOT built with
# shaderc support, due to compatibility issues on Linux. We'll fix it later.
# dvz.app_run(app, 0)

# Cleanup.
dvz.app_destroy(app)