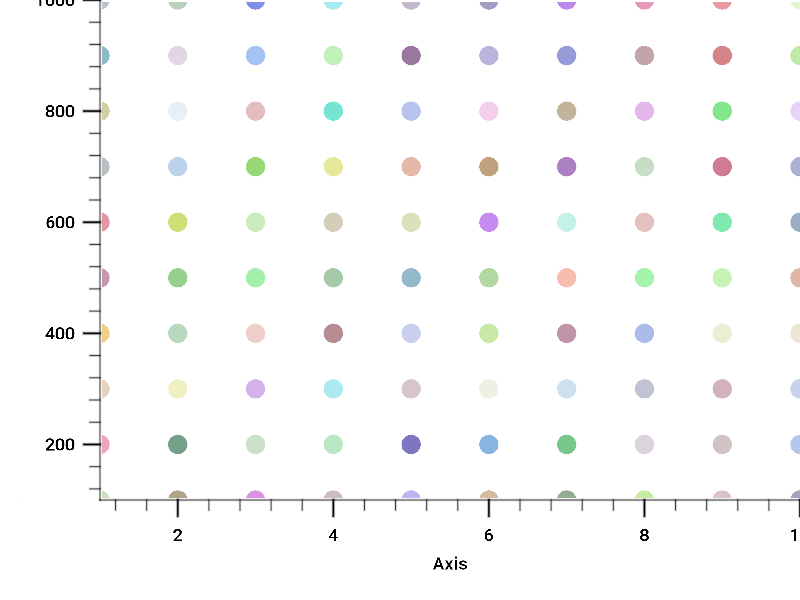
Axes
Show how to use 2D axes.
Tags: point, axes, mouse
import numpy as np

import datoviz as dvz

rng = np.random.default_rng(seed=3141)

n = 10
xmin, xmax = 1, 10
ymin, ymax = 100, 1000
x, y = np.meshgrid(np.linspace(xmin, xmax, n), np.linspace(ymin, ymax, n))
nn = x.size
color = rng.integers(low=100, high=240, size=(nn, 4), dtype=np.uint8)
size = np.full(nn, 20)

app = dvz.App(background='white')
figure = app.figure()
panel = figure.panel()
axes = panel.axes((xmin, xmax), (ymin, ymax))

visual = app.point(
    position=axes.normalize(x, y),
    color=color,
    size=size,
)
panel.add(visual)


@app.connect(figure)
def on_mouse(ev):
    if ev.mouse_event() == 'drag':
        xlim, ylim = axes.bounds()
        print(f'x: [{xlim[0]:g}, {xlim[1]:g}] ; y: [{ylim[0]:g}, {ylim[1]:g}]')


app.run()
app.destroy()