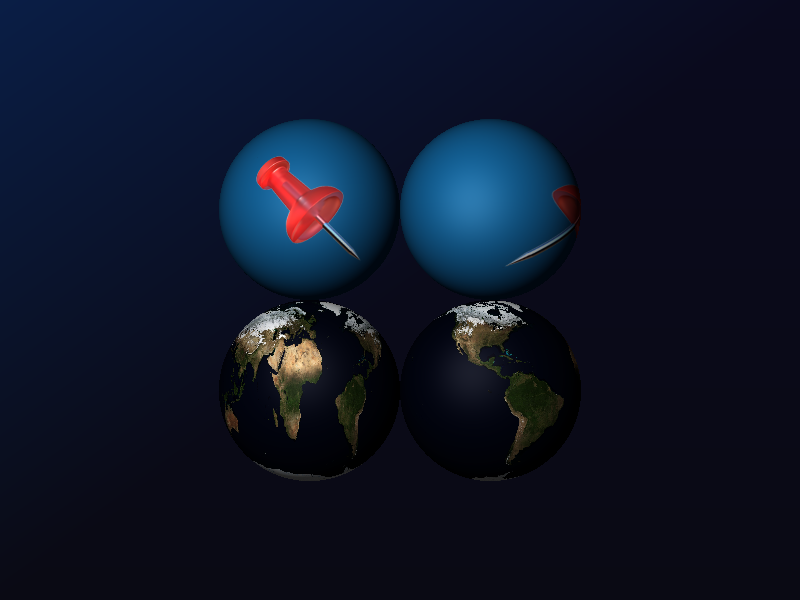
Sphere visual texture example
Show the sphere visual with textures, using different projection modes.
Tags: sphere, texture
import numpy as np
import imageio.v3 as iio

import datoviz as dvz
from datoviz import vec3


def load_texture_rgba(path):
    full_path = dvz.download_data(path)
    arr = iio.imread(full_path)
    return arr


# Default visual values to save work later.
visual_values_defaults = dict(
    position=np.array(((0.0, 0.0, 0.0),), dtype='f'),
    color=np.array(((20, 100, 150, 255),)),
    size=np.array((0.5,), dtype='f'),
    lighting=True,
    light_pos=(-30, +30, +100, 1),
    ambient_params=vec3(0.2, 0.2, 0.2),
    diffuse_params=vec3(0.9, 0.9, 0.9),
    specular_params=vec3(0.5, 0.5, 0.5),
    shine=0.1,
)


# Get app environment.
app = dvz.App()


def get_visual_data():
    # list of visual data to add to panel.
    data = []
    count = 0
    spacing = 2
    pos = np.linspace(0.5, -0.5, spacing)

    # Symbol pattern =============================================================================
    image = load_texture_rgba('textures/pushpin.png')
    # Need to pad edges to avoid over stretching the image.
    p = 100
    image = np.pad(image, ((p, p), (p, p), (0, 0)), 'constant', constant_values=0)

    values = visual_values_defaults.copy()
    y, x = divmod(count, spacing)
    values['position'] = np.array(((-pos[x], pos[y], 0),), dtype='f')
    values['texture'] = app.texture(image, interpolation='linear', address_mode='repeat')
    data.append(values)
    count += 1

    # Symbol pattern with equal_rectangular=True -------------------------------------------------
    values = values.copy()  # Use previous data.
    y, x = divmod(count, spacing)
    values['position'] = np.array(((-pos[x], pos[y], 0),), dtype='f')
    values['equal_rectangular'] = True
    data.append(values)
    count += 1

    # Equal Rectangular Image =====================================================================
    img = load_texture_rgba('textures/world.200412.3x5400x2700.jpg') / 255
    a = np.ones_like(img[..., -1])
    image = np.zeros((img.shape[0], img.shape[1], img.shape[2] + 1), dtype='f')
    image[:, :, :-1] = img
    image[:, :, -1] = a

    values = visual_values_defaults.copy()
    y, x = divmod(count, spacing)
    values['position'] = np.array(((-pos[x], pos[y], 0),), dtype='f')
    values['texture'] = app.texture(image, interpolation='linear', address_mode='repeat')
    data.append(values)
    count += 1

    # Equal rectangular Image with equal_rectangular=True ----------------------------------------
    values = values.copy()  # Start this one with previous data.
    y, x = divmod(count, spacing)
    values['position'] = np.array(((-pos[x], pos[y], 0),), dtype='f')
    values['equal_rectangular'] = True
    data.append(values)
    count += 1

    return data


figure = app.figure()
panel = figure.panel(background=True)
arcball = panel.arcball()

# Create visuals from visual data.
data = get_visual_data()
for visual_data in data:
    visual = app.sphere(**visual_data)
    panel.add(visual)

app.run()
app.destroy()