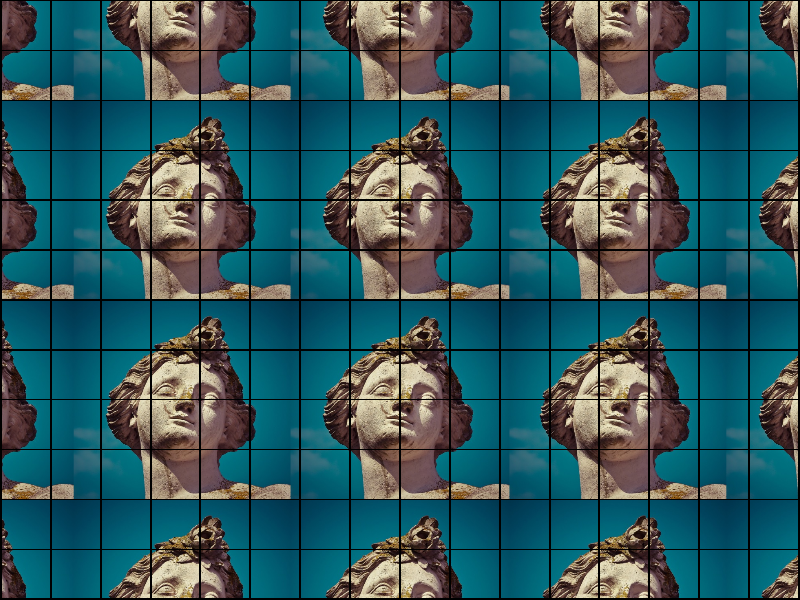
Tiled image grid
Split an image into a grid of smaller images displayed using a single image visual.
Tags: image, texture, panzoom
Extra Python dependencies: imageio
import imageio.v3 as iio
import numpy as np

import datoviz as dvz


def load_image():
    filepath = dvz.download_data('textures/image.png')
    arr = iio.imread(filepath)
    h, w, _ = arr.shape
    return np.dstack((arr, np.full((h, w), 255))).astype(np.uint8)


# Grid parameters
cols, rows = 16, 12
N = cols * rows
margin = 0.005


image = load_image()
height, width, _ = image.shape

# Compute tile size in NDC
extent = 2.0  # NDC range [-1, +1]
tile_w = (extent - margin * (cols + 1)) / cols
tile_h = (extent - margin * (rows + 1)) / rows

# Compute NDC centers of tiles
x_lin = np.linspace(-1 + margin + tile_w / 2, 1 - margin - tile_w / 2, cols)
y_lin = np.linspace(-1 + margin + tile_h / 2, 1 - margin - tile_h / 2, rows)
x_ndc, y_ndc = np.meshgrid(x_lin, y_lin[::-1])
position = (
    np.stack([x_ndc, y_ndc, np.zeros_like(x_ndc)], axis=-1).reshape(-1, 3).astype(np.float32)
)

size = np.full((N, 2), [tile_w, tile_h], dtype=np.float32)

figure_aspect = 4 / 3.0
u_range = figure_aspect
v_range = 1.0
u = np.linspace(-1.333, +2.333, cols + 1)
v = np.linspace(-1.5, 1.5, rows + 1)
u0, v0 = np.meshgrid(u[:-1], v[:-1])
u1, v1 = np.meshgrid(u[1:], v[1:])
texcoords = np.stack([u0, v0, u1, v1], axis=-1).reshape(-1, 4).astype(np.float32)

# Set up Datoviz
app = dvz.App()
figure = app.figure()
panel = figure.panel()
panzoom = panel.panzoom()

visual = app.image(
    position=position,
    size=size,
    unit='ndc',
    texcoords=texcoords,
)
texture = app.texture_2D(image, address_mode='repeat', interpolation='linear')
visual.set_texture(texture)
panel.add(visual)

app.run()
app.destroy()