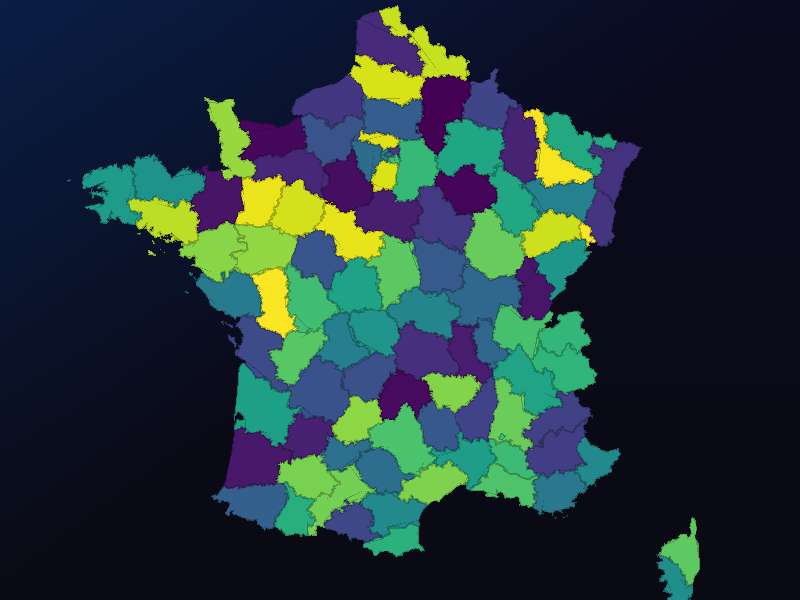
Choropleth map
This example demonstrates how to create a choropleth map using polygons. It loads polygon data from a NumPy file, generates a unique color for each polygon, and visualizes them using the Mesh visual. The polygons are displayed with contours.
A Basic visual could also have been used, but it would not support contours.
Warning
There may be visual artifacts along the contours of highly irregular polygons, such as those in this example. These can be resolved with a more robust triangulation algorithm. Improvements are planned for a future release.
Tags: mesh, shape, colormap, polygon, ortho, choropleth
import numpy as np

import datoviz as dvz

# Load polygons from france.npz
data = np.load(dvz.download_data('misc/france.npz'))
arrays = [data[key] for key in data]

# Generate unique colors
colors = dvz.cmap('viridis', np.linspace(0, 1, len(arrays)))

# Create shape collection and add polygons
sc = dvz.ShapeCollection()
for points, color in zip(arrays, colors):
    sc.add_polygon(points, color=color, contour=True)

app = dvz.App()
figure = app.figure()
panel = figure.panel(background=True)
ortho = panel.ortho()

visual = app.mesh(sc, linewidth=1, edgecolor=(0, 0, 0, 64))
panel.add(visual)

app.run()
app.destroy()
sc.destroy()