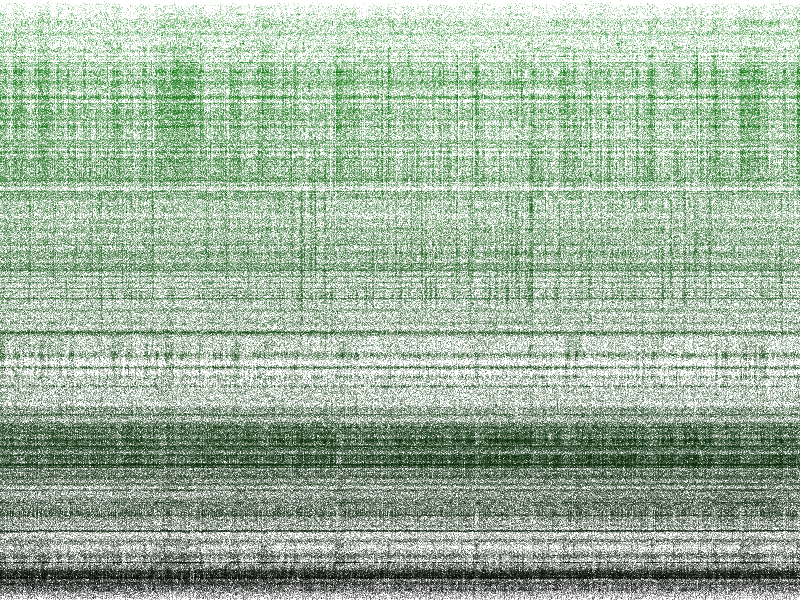
Raster plot with the Pixel visual
Show a raster plot (spikes in 2D, time on the x axis, neuron depth on the y axis) using the Pixel visual.
Tags: pixel, panzoom
import numpy as np

import datoviz as dvz

N = 1_000_000  # maximum number of spikes

# Load the data.
data = np.load(dvz.download_data('misc/raster_1M.npz'))
t = data['times'][:N]  # Spike times in seconds
d = data['depths'][:N]  # Depth in microns

# Normalization.
t_min, t_max = t.min(), t.max()
t_norm = 2 * (t - t_min) / (t_max - t_min) - 1

d_min, d_max = d.min(), d.max()
d_norm = 2 * (d - d_min) / (d_max - d_min) - 1

positions = np.c_[t_norm, d_norm, np.zeros_like(t_norm)].astype(np.float32)
num_points = positions.shape[0]

colors = np.full((num_points, 4), 0, dtype=np.uint8)
colors[:] = dvz.cmap('kg', d, d_min, d_max)
colors[:, 3] = 64

# -------------------------------------------------------------------------------------------------

app = dvz.App(background='white')
figure = app.figure()
panel = figure.panel()
panzoom = panel.panzoom()

visual = app.pixel(position=positions, color=colors)
panel.add(visual)

app.run()
app.destroy()