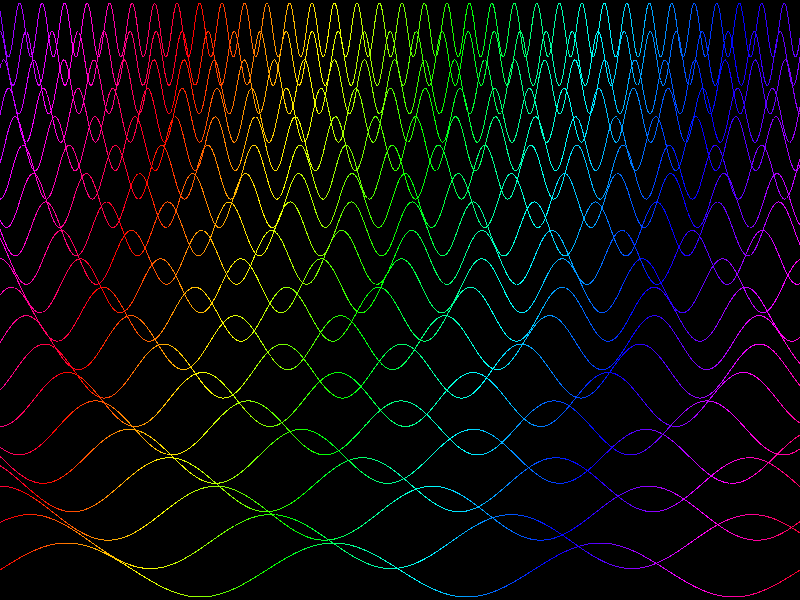
Basic visual
Show the basic visual with line strip topology and groups.
Tags: basic, panzoom
import numpy as np

import datoviz as dvz


def generate_data(n_groups=20, n_samples=1_000):
    N = n_groups * n_samples

    t = np.linspace(-1, 1, n_samples)
    group_indices = np.arange(n_groups)
    y_base = np.linspace(-1, 1, n_groups)

    positions = np.zeros((N, 3), dtype=np.float32)
    groups = np.zeros(N, dtype=np.float32)

    for i, g in enumerate(group_indices):
        freq = 1 + 2 * np.exp(0.15 * i)
        phase = g * np.pi / 4
        y_offset = y_base[i]
        y = y_offset + 0.1 * np.sin(2 * np.pi * freq * (t + 1) / 2 + phase)

        start = i * n_samples
        end = (i + 1) * n_samples
        positions[start:end, 0] = t
        positions[start:end, 1] = y
        positions[start:end, 2] = 0.0
        groups[start:end] = float(g)

    t = np.linspace(0, n_groups - 0.25, N)
    t = np.mod(t, 1).astype(np.float32)
    colors = dvz.cmap('hsv', t, 0, 1)
    positions[:, 1] *= 0.9
    return N, positions, colors, groups


N, position, color, group = generate_data()

app = dvz.App()
figure = app.figure()
panel = figure.panel()
panzoom = panel.panzoom()

visual = app.basic('line_strip', position=position, color=color, group=group)
panel.add(visual)

app.run()
app.destroy()