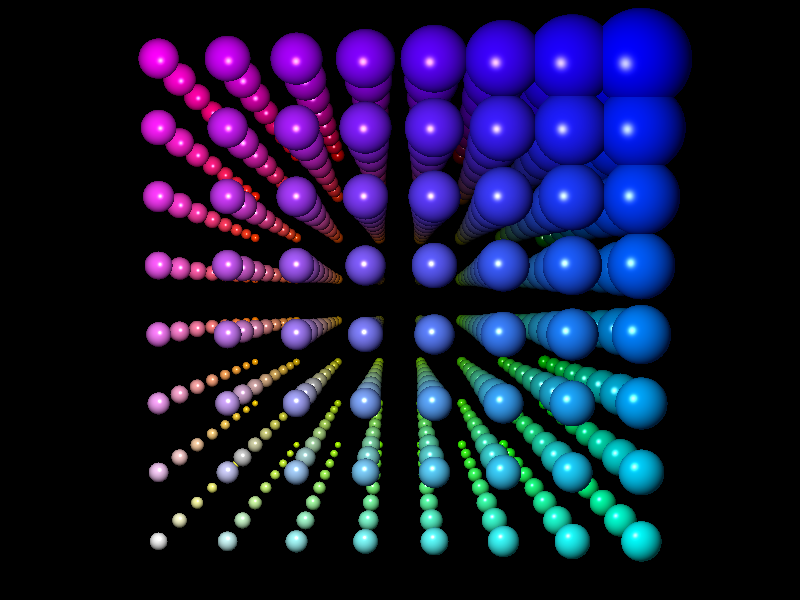
Sphere visual
Show the sphere visual.
Tags: sphere, arcball
import numpy as np

import datoviz as dvz


def generate_ndc_grid(n):
    lin = np.linspace(-1, 1, n)
    x, y, z = np.meshgrid(lin, lin, lin, indexing='ij')
    positions = np.stack([x, y, z], axis=-1).reshape(-1, 3)

    # Normalize each coordinate to [0, 1] for radius/color mapping
    x_norm = (x + 1) / 2
    y_norm = (y + 1) / 2
    z_norm = (z + 1) / 2

    # Radius increases linearly in all directions (can be tuned)
    size = 0.01 + 0.01 * np.exp(1 * (x_norm + y_norm + z_norm))
    size = size.flatten()

    r = x_norm.flatten()
    g = y_norm.flatten()
    b = z_norm.flatten()
    a = np.ones_like(r)
    rgb = np.stack([r[::-1], g[::-1], b, a], axis=1)
    rgb = (255 * rgb).astype(np.uint8)

    return positions.shape[0], positions, rgb, size


N, position, color, size = generate_ndc_grid(8)

width, height = 800, 600
app = dvz.App()
figure = app.figure()
panel = figure.panel(offset=(0, 0), size=(width, height))
arcball = panel.arcball()

visual = app.sphere(
    position=position,
    color=color,
    size=size,
    lighting=True,
    shine=0.8,
)
panel.add(visual)

app.run()
app.destroy()