Main Concepts
This page explains how figures, panels, and axes define the visual layout in Datoviz. It also covers how to properly position data in Normalized Device Coordinates (NDC), which all visuals require.
Figures and Panels
A figure is a window or drawing surface. It contains one or more panels, which are rectangular subregions used to organize visuals.
figure = app.figure(800, 600)
panel = figure.panel((50, 50), (700, 500))
- The panel's position and size are given in pixels:
(x, y)for the top-left corner and(w, h)for the dimensions. - Panels automatically resize proportionally when the figure window is resized.
- Customizing this behavior (e.g. fixed-size panels) will be documented soon.

If you omit position and size, the panel fills the entire figure:
panel = figure.panel()
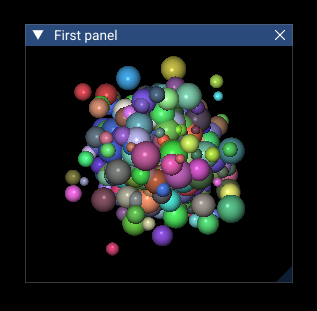
GUI panels
Warning
This feature is experimental and may not work reliably yet.
Experimental support for GUI panels is available: instead of occupying a fixed region of the figure, a GUI panel includes a top bar and can be resized, dragged with the mouse, and docked to the window edge or to another panel. This is implemented using Dear ImGui.
To use it, enable GUI support when creating the figure with figure = app.figure(gui=True). Then, for each panel you want to wrap in a GUI window, simply do:
panel.gui('Panel name')
Axes (2D only)
Axes for 2D data can be added to any panel as follows:
axes = panel.axes((xmin, xmax), (ymin, ymax))
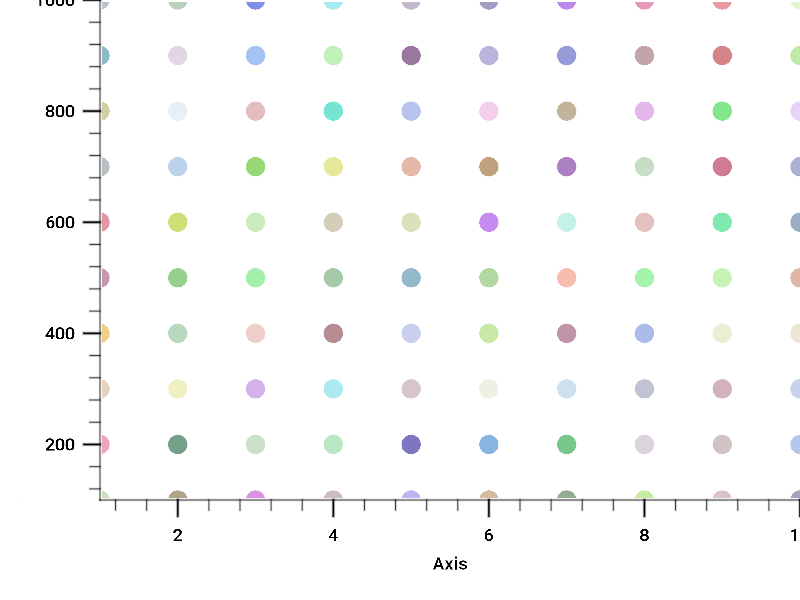
This uses a pan-and-zoom interaction pattern with the mouse. It should not be used on panels with 3D data (arcball), as 3D axes are not yet supported.
This:
- Draws X and Y axes with ticks and labels.
- Enables mouse-based pan and zoom interactivity.
- Defines the data limits for normalization.
Coordinate system
All visuals in Datoviz expect their position input in 3D Normalized Device Coordinates (NDC) — a 3D coordinate system where all values lie in the range [-1, +1] on each axis.

The position is always an (N, 3) array with x, y, z components in NDC.
You have two options when preparing your data:
1. Manual normalization
If you normalize your data manually, pass it directly to the visual:
norm_pos = 2 * (data - data.min()) / (data.max() - data.min()) - 1
app.point(position=norm_pos)
2. Use axes.normalize(x, y)
The preferred method when using 2D axes is to use the axes.normalize() function:
axes = panel.axes((xmin, xmax), (ymin, ymax))
position = axes.normalize(x, y)
visual = app.point(position=position)
This does two things:
- Converts the data to NDC using the current axis limits.
- Ensures that ticks, labels, and interactivity match the transformed coordinates.
This approach keeps your data in its original units while making it compatible with the NDC rendering model.
Colors
Datoviz includes built-in support for colormaps.
Most visuals and functions expect colors in cvec4 format: four uint8 integers in the 0–255 range representing the RGBA channels (red, green, blue, alpha).
The dvz.cmap() function generates an (N, 4) array of uint8 RGBA values using one of the built-in colormaps. For example:
color = dvz.cmap('hsv', np.linspace(-1, 1, 100), vmin=-1, vmax=+1)
# color is an (100, 4) array
Screenshots
You can save a PNG screenshot of a figure as follows:
app.screenshot(figure, 'screenshot.png')
Warning
Screenshots currently do not support GUIs. This feature will be available in Datoviz v0.4.
Summary
- Use
figure()to create a window, andpanel()to define drawable regions. - Panels are defined in pixel coordinates and resize proportionally.
- Axes are 2D, provide labels/ticks, and enable interactivity.
- All visuals require NDC input — use
axes.normalize()to transform and align your data easily.