Quickstart
This quickstart guide shows how to create an interactive 2D scatter plot with Datoviz. The plot includes axes, pan and zoom interactivity, and customizable visuals.
Requirements
Make sure you have Python and NumPy installed. You can install Datoviz via pip:
pip install datoviz
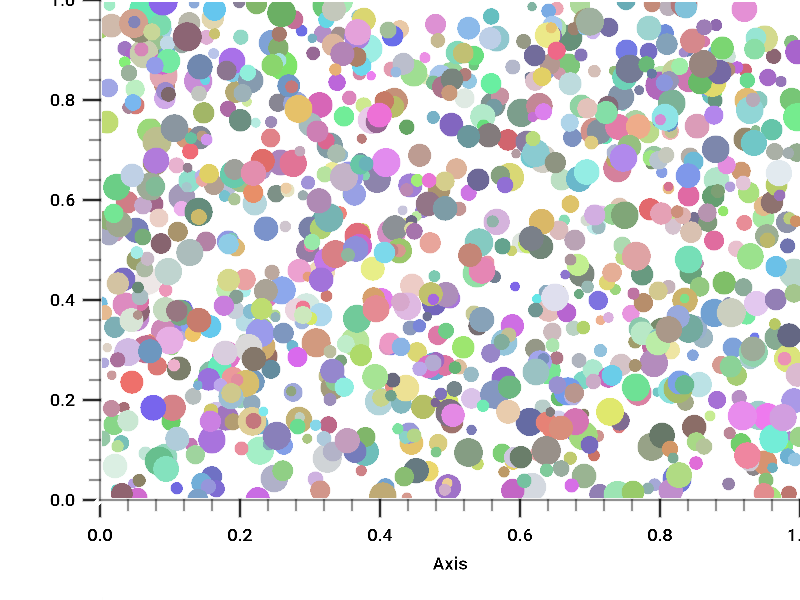
What you'll build
The following script generates 1,000 randomly positioned, colored, and sized points in a 2D scatter plot:
Example code
import numpy as np

import datoviz as dvz

# Number of points
n = 1000

# Generate random (x, y) coordinates
x, y = np.random.rand(2, n)

# Generate RGBA colors (uint8 in range [0, 255])
color = np.random.randint(100, 240, size=(n, 4), dtype=np.uint8)
color[:, 3] = 255  # full opacity

# Generate random point sizes (in pixels)
size = np.random.uniform(10, 30, size=n)

# Create a Datoviz app with a white background
app = dvz.App(background='white')

# Create an 800x600 window
figure = app.figure(800, 600)

# Add a panel (like a subplot) to the figure.
# By default, it spans the entire figure.
panel = figure.panel()

# Define axis limits
xlim = 0, 1
ylim = 0, 1

# Add 2D axes to the panel with pan/zoom support
axes = panel.axes(xlim, ylim)

# Create a scatter plot visual
visual = app.point(
    position=axes.normalize(x, y),  # map to normalized device coordinates
    color=color,
    size=size,
)

# Add the visual to the panel
panel.add(visual)

# Run the app (starts the event loop and opens the window)
app.run()

# Clean up after the window is closed
app.destroy()