Basic Visual
The basic visual in Datoviz provides direct access to low-level GPU rendering using core Vulkan primitives.
This visual is well suited for rendering large-scale data as points, thin non-antialiased lines, or triangles, with one color per vertex.
Note
Crude antialiasing techniques may be added in a future version. In the meantime, these visuals are heavily aliased but remain highly efficient.
Overview
- Uses core Vulkan primitive topologies:
point,line_strip,line_list,triangle_list, andtriangle_strip - Accepts 3D NDC positions
- Supports per-vertex color
- Supports uniform size but not per-vertex size
- Supports a
groupattribute to separate primitives within a single visual
When to use
Use the basic visual when you need:
- Large-scale, uniform visual primitives
- Full control over rendering topology
- Minimal overhead and high performance
Properties
Per-item
| Attribute | Type | Description |
|---|---|---|
position |
(N, 3) float32 |
Vertex positions in NDC |
color |
(N, 4) uint8 |
RGBA color per vertex |
group |
(N,) float32 |
Group ID used to separate primitives (line_strip and triangle_strip) |
Per-visual (uniform)
| Parameter | Type | Description |
|---|---|---|
size |
float |
Pixel size for point topology |
Grouping
The group attribute allows you to encode multiple disconnected geometries in one visual.
For example, rendering many time series as separate line strips:
visual = app.basic('line_strip', position=position, color=color, group=group)
- Each group must be identified by a consecutive integer ID:
0, 0, ..., 1, 1, ..., 2, 2, ... - Transitions between groups break the connection in line-based topologies.
This approach is memory-efficient and avoids multiple draw calls.
Topologies
Here, we show the different primitive topologies for the Basic visual using the same set of positions, colors, and groups.
The 2D points alternate between a lower and upper sine curves. The points are split in two groups with equal size (the group is 0 if i < N/2 and 1 if i >= N/2).
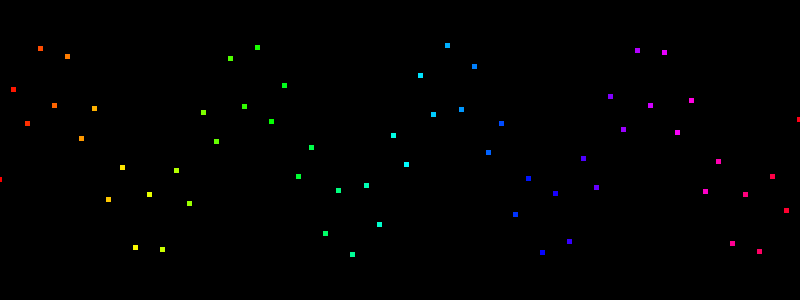
Points
Renders one dot per vertex. Similar to the Pixel visual.
visual = app.basic('point_list', position=position, color=color, size=5)
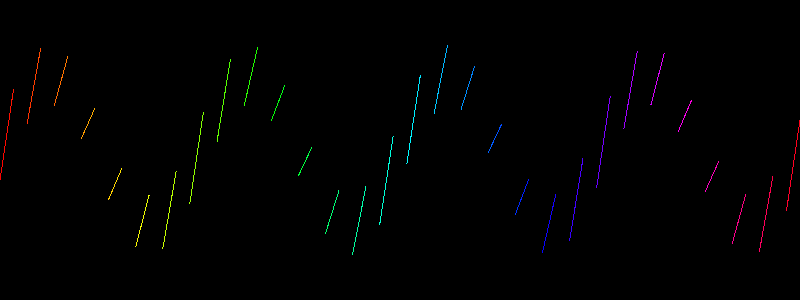
Line list
Each pair of vertices forms a separate segment: A-B, C-D, E-F, etc.
visual = app.basic('line_list', position=position, color=color)
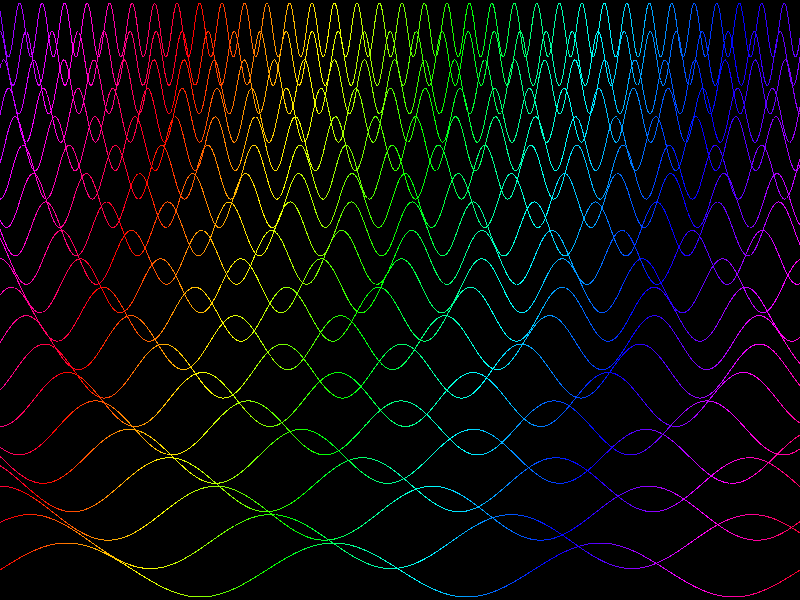
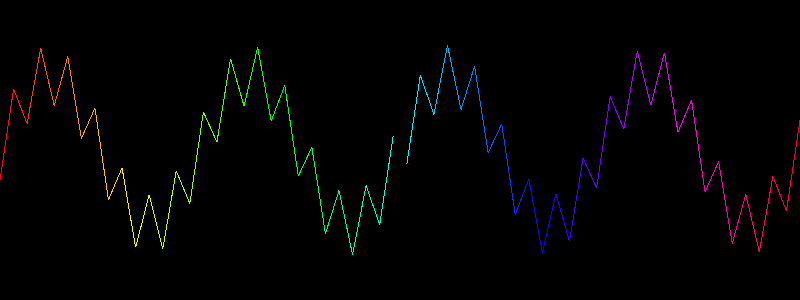
Line strip
Connects vertices into a continuous path: A-B-C-D becomes a single polyline.
visual = app.basic('line_strip', position=position, color=color, group=group)
Note
The optional group attribute can be used to draw multiple line strips in one call, which is best for performance. Note the gap in the middle, corresponding to the transition between the two groups.
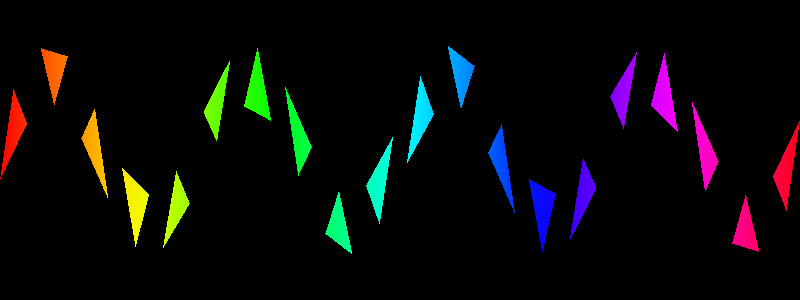
Triangle list
Each group of 3 vertices forms a triangle: A-B-C, D-E-F, etc.
visual = app.basic('triangle_list', position=position, color=color)
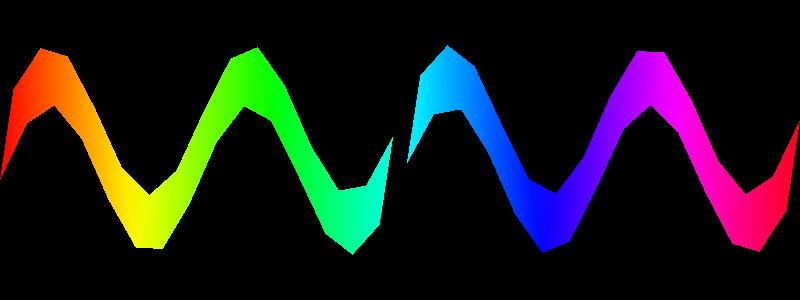
Triangle strip
Renders connected triangles using a strip pattern: A-B-C, B-C-D, C-D-E, etc.
visual = app.basic('triangle_strip', position=position, color=color, group=group)
Note
The optional group attribute can be used to draw multiple triangle strips in one call, which is best for performance. Note the gap in the middle, corresponding to the transition between the two groups.
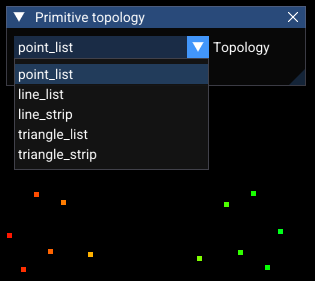
Dynamic topology change
This example displays a GUI to change the topology of the Basic visual.
Warning
Changing visual options dynamically is not fully supported yet, so we use a workaround that involves deleting and recreating the visual. This will be improved in Datoviz v0.4.
Source
import sys

import numpy as np

import datoviz as dvz

OPTIONS = dvz.TOPOLOGY_OPTIONS

N = 30
t2 = np.linspace(-1.0, +1.0, 2 * N)
y1 = -0.1 + 0.25 * np.sin(2 * 2 * np.pi * t2[0::2])
y2 = +0.1 + 0.25 * np.sin(2 * 2 * np.pi * t2[1::2])

y = np.c_[y1, y2].ravel()

position = np.c_[t2, y, np.zeros(2 * N)]
group = np.repeat([0, 1], N)
color = dvz.cmap('hsv', t2, vmin=-1, vmax=+1)

app = dvz.App()
figure = app.figure(gui=True)
panel = figure.panel()
panzoom = panel.panzoom()
visual = None


def set_primitive(primitive):
    global visual
    if visual:
        panel.remove(visual)
    visual = app.basic(primitive, position=position, color=color, group=group, size=5)
    panel.add(visual)


set_primitive(sys.argv[1] if len(sys.argv) >= 2 else 'point_list')

selected = dvz.Out(0)


@app.connect(figure)
def on_gui(ev):
    dvz.gui_pos(dvz.vec2(10, 10), dvz.vec2(0, 0))
    dvz.gui_size(dvz.vec2(300, 80))
    dvz.gui_begin('Primitive topology', 0)
    if dvz.gui_dropdown('Topology', len(OPTIONS), list(OPTIONS), selected, 0):
        primitive = OPTIONS[selected.value]
        set_primitive(primitive)
    dvz.gui_end()


app.run()
app.destroy()
Example
import matplotlib.colors as mcolors
import numpy as np

import datoviz as dvz


def generate_data():
    """Return N, positions (N,3) float32, colors (N,4) uint8"""
    # Parameters
    n_arms = 5
    n_particles_per_arm = 200_000
    n_total = n_arms * n_particles_per_arm

    rng = np.random.default_rng(seed=42)

    # Radius from center, with more points toward center
    r = rng.power(2.0, size=n_total)  # values in [0, 1), biased toward 0

    # Angle with swirl per arm and some noise
    base_theta = np.repeat(np.linspace(0, 2 * np.pi, n_arms, endpoint=False), n_particles_per_arm)
    swirl = r * 3  # spiral effect
    noise = rng.normal(scale=0.2, size=n_total)
    theta = base_theta + swirl + noise

    # Convert polar to Cartesian
    x = r * np.cos(theta) * 6.0 / 8.0  # HACK: window aspect ratio
    y = r * np.sin(theta)
    z = np.zeros_like(x)

    positions = np.stack([x, y, z], axis=1).astype(np.float32)

    # Colors based on radius and angle — create a vibrant, cosmic feel
    hue = (theta % (2 * np.pi)) / (2 * np.pi)  # hue from angle
    saturation = np.clip(r * 1.5, 0.2, 1.0)  # more saturated at edges
    value = np.ones_like(hue)

    # Convert HSV to RGB

    rgb = mcolors.hsv_to_rgb(np.stack([hue, saturation, value], axis=1))
    rgb_u8 = (rgb * 255).astype(np.uint8)

    # Alpha: slight fade with radius
    alpha = np.clip(128 * (1.0 - r), 1, 255).astype(np.uint8)
    alpha = (200 * np.exp(-5 * r * r)).astype(np.uint8)

    colors = np.concatenate([rgb_u8, alpha[:, None]], axis=1)

    return n_total, positions, colors


N, position, color = generate_data()

app = dvz.App()
figure = app.figure()
panel = figure.panel()
panzoom = panel.panzoom()

visual = app.pixel(position=position, color=color)
panel.add(visual)

app.run()
app.destroy()
Summary
The basic visual provides direct access to the core rendering capabilities of Datoviz. It's powerful, fast, and flexible — ideal for high-volume data when you don’t need complex styling.
For advanced visuals with lighting, texturing, or custom shapes, see the other visuals.