Marker Visual
The Marker visual is a versatile and customizable point visual that supports symbolic shapes, rotation, borders, and texture-based rendering. It is ideal for labeled scatter plots, categorized data points, or any visualization that needs distinct marker styles.

Overview
- Renders symbolic shapes (e.g., disc, triangle, square)
- Supports custom SVGs, bitmap textures, and SDF/MSDF formats
- Each marker has per-vertex position, color, size, and rotation
- Can be filled, bordered, or outlined-only
- Supports uniform control of border width, edge color, and texture scaling
Note
Currently, all markers within a single visual share the same shape. To display multiple shapes, use a separate visual for each marker type and group the points accordingly.
When to use
Use the marker visual when:
- You want distinct shapes for different data categories
- You need rotation, border, or outline styling per marker
- You want to use custom textures (SVG, bitmap, SDF/MSDF)
- You need high flexibility for scatter or symbol-based plots
Properties
Options
| Option | Type | Description |
|---|---|---|
shape |
enum | Marker shape (only used when mode='code') |
mode |
enum | Rendering mode (code, bitmap, sdf, msdf) |
aspect |
enum | Aspect ratio behavior |
Per-item
| Attribute | Type | Description |
|---|---|---|
position |
(N, 3) float32 |
Marker position in NDC |
color |
(N, 4) uint8 |
Fill color per marker |
size |
(N,) float32 |
Diameter in framebuffer pixels |
angle |
(N,) float32 |
Rotation angle in radians |
Per-visual (uniform)
| Attribute | Type | Description |
|---|---|---|
linewidth |
float | Outline width in pixels |
edgecolor |
cvec4 | Outline color (applied uniformly) |
tex_scale |
float | Global scaling factor for all markers |
texture |
texture | Texture object for bitmap/SDF/MSDF modes |
Rendering modes
The visual supports four rendering modes:
| Mode | Description |
|---|---|
code |
Uses GPU-coded built-in shapes (fastest) |
bitmap |
Uses a bitmap texture |
sdf |
Uses a signed distance field texture |
msdf |
Uses a multichannel signed distance field |
Note
For SDF and MSDF, Datoviz bundles the Multi-channel signed distance field generator C++ library.
Code
The following predefined marker shapes, implemented on the GPU, are supported when using mode='code':
| Marker | Value | Image |
|---|---|---|
disc |
0 | 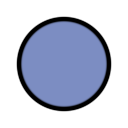 |
asterisk |
1 |  |
chevron |
2 | 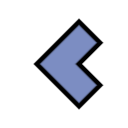 |
clover |
3 |  |
club |
4 | 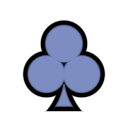 |
cross |
5 | 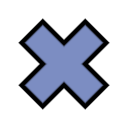 |
diamond |
6 | 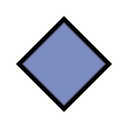 |
arrow |
7 |  |
ellipse |
8 | 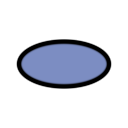 |
hbar |
9 | 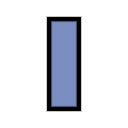 |
heart |
10 |  |
infinity |
11 | 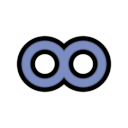 |
pin |
12 |  |
ring |
13 |  |
spade |
14 | 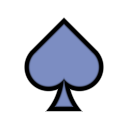 |
square |
15 | 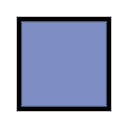 |
tag |
16 |  |
triangle |
17 | 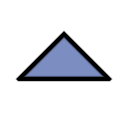 |
vbar |
18 | 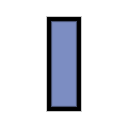 |
Bitmap
A bitmap texture with the marker to render.
SDF
The SDF mode (Signed Distance Field) encodes the distance from the marker's outline in a single channel. This allows for resolution-independent rendering with crisp edges and efficient antialiasing.
MSDF
The MSDF mode (Multi-channel Signed Distance Field) encodes distance separately in RGB channels, enabling sharper rendering of complex shapes (e.g. icons) with fewer artifacts.
Warning
The documentation for the rendering modes above is incomplete. Contributions are welcome.
Aspect
The aspect attribute controls how each marker is rendered, using aspect='filled' for example:
| Aspect value | Description | Image |
|---|---|---|
filled |
Fill only, no border (default) |  |
stroke |
Border only, transparent interior |  |
outline |
Fill with border (filled + stroke combined) |  |
These aspects are customized with the following properties:
color: fill color (per marker)edgecolor: outline color (uniform)linewidth: outline thickness (uniform, in pixels)
Example
from pathlib import Path

import imageio.v3 as iio
import numpy as np

import datoviz as dvz

ROOT_DIR = Path(__file__).resolve().parent.parent.parent
W, H = 800, 600
HW, HH = W / 2.0, H / 2.0
svg_path = 'M50,10 L61.8,35.5 L90,42 L69,61 L75,90 L50,75 L25,90 L31,61 L10,42 L38.2,35.5 Z'


def generate_data():
    grid_x = 6
    grid_y = 5
    N = grid_x * grid_y

    # Grid coordinates in [-1, 1]
    x = np.linspace(-1, 1, grid_x)
    y = np.linspace(-1, 1, grid_y)
    X, Y = np.meshgrid(x, y)
    x_flat = X.flatten()
    y_flat = Y.flatten()
    z_flat = np.zeros_like(x_flat)

    positions = np.stack([x_flat, y_flat, z_flat], axis=1).astype(np.float32)
    positions *= 0.8  # margin

    # Hue along x-axis
    hue = (x_flat + 1) / 2
    colors = dvz.cmap('hsv', hue)

    # Size: exponential growth from 10px to 50px along y-axis
    y_norm = (y_flat + 1) / 2
    sizes = 25 * 2.0**y_norm
    sizes = sizes.astype(np.float32)

    return N, positions, colors, sizes


def load_texture_rgba(path):
    arr = iio.imread(path)
    return arr


def make_texture(image):
    assert image.ndim == 3
    assert image.shape[2] == 4
    assert image.dtype == np.uint8
    return app.texture(image)


def make_svg_msdf_texture(svg_path, size=64):
    msdf = dvz.msdf_from_svg(svg_path, size, size)
    msdf_alpha = np.empty((size, size, 4), dtype=np.float32)
    dvz.rgb_to_rgba_float(size * size, msdf, msdf_alpha.ravel())
    return app.texture(msdf_alpha)


def make_visual(panel):
    N, position, color, size = generate_data()
    angle = np.linspace(0, 2 * np.pi, N)
    visual = app.marker(
        position=position,
        color=color,
        size=size,
        angle=angle,
        edgecolor=(255, 255, 255, 255),
        linewidth=2.0,
    )
    panel.add(visual)
    return visual


app = dvz.App()
figure = app.figure()

# Code Outline
panel = figure.panel(offset=(0, 0), size=(HW, HH))
visual = make_visual(panel)
visual.set_mode('code')
visual.set_aspect('outline')
visual.set_shape('club')  # pre-defined shapes coded in the shaders

# Bitmap
panel = figure.panel(offset=(HW, 0), size=(HW, HH))
visual = make_visual(panel)
visual.set_mode('bitmap')
visual.set_aspect('filled')
visual.set_shape('club')
image = load_texture_rgba(dvz.download_data('textures/pushpin.png'))
texture = make_texture(image)
visual.set_texture(texture)  # bitmap textures

# Code Stroke
panel = figure.panel(offset=(0, HH), size=(HW, HH))
visual = make_visual(panel)
visual.set_mode('code')
visual.set_aspect('stroke')
visual.set_shape('spade')

# SVG
panel = figure.panel(offset=(HW, HH), size=(HW, HH))
visual = make_visual(panel)
visual.set_tex_scale(100)  # Important: let the visual know about the texture size
visual.set_mode('msdf')
visual.set_aspect('outline')
msdf = make_svg_msdf_texture(svg_path, size=100)
visual.set_texture(msdf)

app.run()
app.destroy()
Summary
The marker visual combines flexibility, performance, and clarity for symbolic point visualization.
- ✔️ Custom shapes and rotation
- ✔️ Support for vector or bitmap textures
- ✔️ Per-marker styling and global controls
- ❌ Not intended for ultra-dense clouds (use Point or Pixel for that)
See also: