Path Visual
The Path visual renders continuous polylines — sequences of connected line segments that form a single open or closed path. It supports batch rendering with multiple disconnected paths per visual, per-vertex styling and optional variable thickness, making it well-suited for contours, trajectories, and line-based annotations.
Note
This visual is powerful and high-quality, but not optimized or scalable to millions of points. For very large datasets, use the lower-quality but more scalable Basic visual instead, with the line_strip primitive and groups.
Overview
- Renders connected polylines from vertex sequences
- Supports per-vertex color and linewidth
- Each group of vertices forms an independent path
- Optional cap and join styles for line ends and corners
Warning
Dashed paths are not yet implemented.
When to use
Use the path visual when:
- You want to draw 2D or 3D trajectories or contours
- You need continuous, styled polylines with thickness
- You want to render multiple independent paths in one visual
Properties
Per-item
| Attribute | Type | Description |
|---|---|---|
position |
(N, 3) float32 |
Vertex positions in NDC |
color |
(N, 4) uint8 |
RGBA color per vertex |
linewidth |
(N,) float32 |
Line thickness in pixels |
Per-visual (uniform)
| Parameter | Type | Description |
|---|---|---|
cap |
enum | Cap style at the start/end of each path |
join |
enum | Join style between connected segments |
Cap and join styles are defined by enums from the Vulkan line rendering system.
Cap types
Each path endpoint can be rendered with a custom cap style:
| Cap Name | Image |
|---|---|
round |
 |
triangle_in |
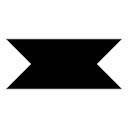 |
triangle_out |
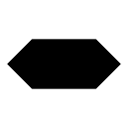 |
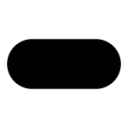
square |
 |
butt |
 |
Joint styles
| Cap Name |
|---|
square |
round |
Grouping paths
Each visual can include multiple independent paths. Use visual.set_position() to specify how the data is grouped. You can pass either:
- A list of arrays, where each array defines one path
-
A single position array, and an additional argument
groupswhich is either:int: number of paths (the position array is split in that number of equal size sub-paths)np.ndarray: an array of group size integers
Each group becomes a separate, continuous polyline.
Large-scale paths
For very large paths (e.g. time series with millions of points), you may prefer the Basic visual with line_strip topology. This will be more efficient but offers no line width or styling.
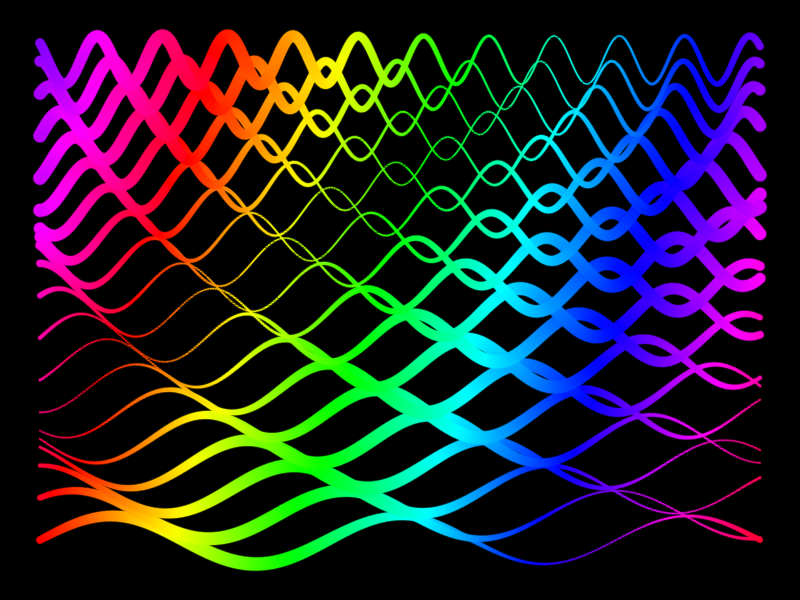
Example
import numpy as np

import datoviz as dvz


def generate_data(n_groups=20, n_samples=10_000):
    N = n_groups * n_samples

    t = np.linspace(-1, 1, n_samples)
    group_indices = np.arange(n_groups)
    y_base = np.linspace(-1, 1, n_groups)

    positions = np.zeros((N, 3), dtype=np.float32)
    linewidths = np.zeros(N, dtype=np.float32)

    for i, g in enumerate(group_indices):
        freq = 1 + 1.5 * np.exp(0.1 * i)
        phase = g * np.pi / 4
        y_offset = y_base[i]
        y = y_offset + 0.1 * np.sin(2 * np.pi * freq * (t + 1) / 2 + phase)

        start = i * n_samples
        end = (i + 1) * n_samples
        positions[start:end, 0] = t
        positions[start:end, 1] = y
        positions[start:end, 2] = 0.0

    t = np.linspace(0, n_groups - 0.25, N).astype(np.float32)
    t = np.mod(t, 1)
    colors = dvz.cmap('hsv', t, 0, 1)

    positions[:, 0] *= 0.9
    positions[:, 1] *= 0.8

    linewidths = np.linspace(0, 1, N)
    linewidths = 8 + 6 * np.sin(2 * (n_groups - 1) * np.pi * linewidths)
    linewidths = linewidths.astype(np.float32)

    return N, positions, colors, linewidths


n_groups = 20
n_samples = 1_000
N = n_groups * n_samples
N, position, color, linewidth = generate_data(n_groups=n_groups, n_samples=n_samples)
lengths = np.full(n_groups, n_samples, dtype=np.uint32)

app = dvz.App()
figure = app.figure()
panel = figure.panel()
panzoom = panel.panzoom()

visual = app.path()
visual.set_position(position, groups=n_groups)
visual.set_data(color=color, linewidth=linewidth, cap='round', join='round')
panel.add(visual)

app.run()
app.destroy()
Summary
The path visual is ideal for rendering styled, continuous line sequences.
- ✔️ Variable thickness and color
- ✔️ Multiple independent paths per visual
- ✔️ Custom caps and joins
- ❌ No dashed line support yet
See also: