Segment Visual
The Segment visual renders independent line segments between pairs of 3D positions. Each segment can have its own color, thickness, shift.
Overview
- Each segment is defined by an initial and terminal 3D point
- Supports per-segment color, linewidth, and shift
- Customizable caps: round, square, triangle, butt, etc.
- Fast and flexible for disconnected line data
Note
2D arrows are not yet supported in the segment visual. For now, consider using the Marker visual with an arrow shape, or the 3D Shape API to generate 3D arrows, which can be rendered using the Mesh visual.
When to use
Use the segment visual when:
- You want to render many disjoint lines or vectors
- You need variable width, style, or shift per segment
Properties
Per-item
| Attribute | Type | Description |
|---|---|---|
position |
(N, 3) x 2 |
Initial and terminal 3D points (NDC) |
color |
(N, 4) uint8 |
RGBA color per segment |
linewidth |
(N,) float32 |
Line thickness in pixels |
shift |
(N, 4) float32 |
Pixel offset applied to both endpoints |
Per-visual (uniform)
| Parameter | Type | Description |
|---|---|---|
cap |
enum x 2 |
Cap type (for both ends) |
Cap types
Each segment endpoint can be rendered with a custom cap style:
| Cap Name | Image |
|---|---|
round |
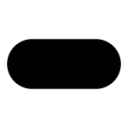 |
triangle_in |
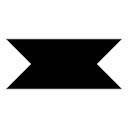 |
triangle_out |
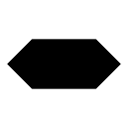 |
square |
 |
butt |
 |
Use visual.set_cap(initial, terminal) to set cap styles.
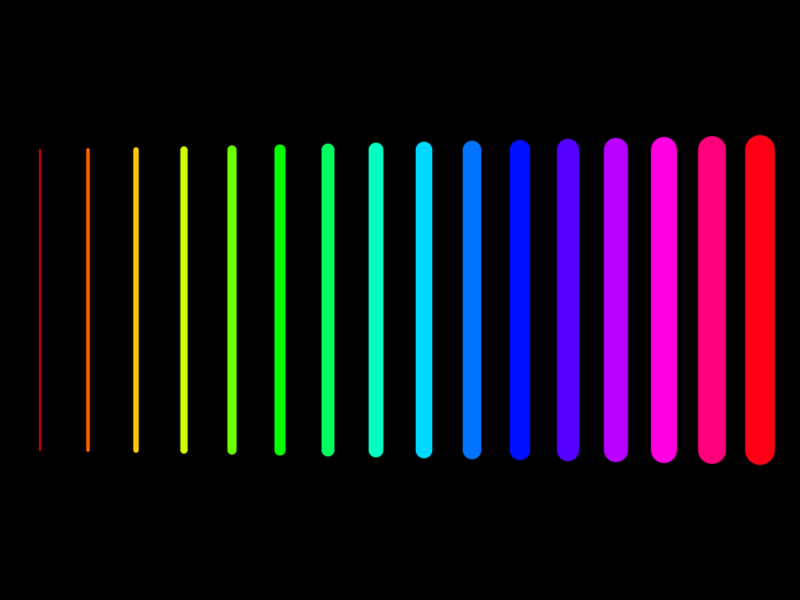
Example
import numpy as np

import datoviz as dvz


def generate_data():
    N = 16

    x = np.linspace(-1, 1, N).astype(np.float32) * 0.9
    y0 = -0.5
    y1 = 0.5
    z = 0.0

    initial = np.stack([x, np.full(N, y0), np.full(N, z)], axis=1).astype(np.float32)
    terminal = np.stack([x, np.full(N, y1), np.full(N, z)], axis=1).astype(np.float32)

    linewidths = np.linspace(2, 30, N).astype(np.float32)

    t = np.linspace(0, 1, N).astype(np.float32)
    colors = dvz.cmap('hsv', t, 0.0, 1.0)

    return N, initial, terminal, colors, linewidths


N, initial, terminal, color, linewidth = generate_data()

app = dvz.App()
figure = app.figure()
panel = figure.panel()
panzoom = panel.panzoom()

visual = app.segment(
    initial=initial,
    terminal=terminal,
    color=color,
    linewidth=linewidth,
    cap=('round', 'round'),
)
panel.add(visual)

app.run()
app.destroy()
Summary
The segment visual is ideal for rendering many disconnected lines with full styling control per segment.
- ✔️ Initial and terminal points
- ✔️ Per-segment color and thickness
- ✔️ Uniform cap
- ✔️ Supports pixel shifting for layering or emphasis
- ❌ Not suitable for continuous paths (see Path instead)
See also: