Wiggle Visual
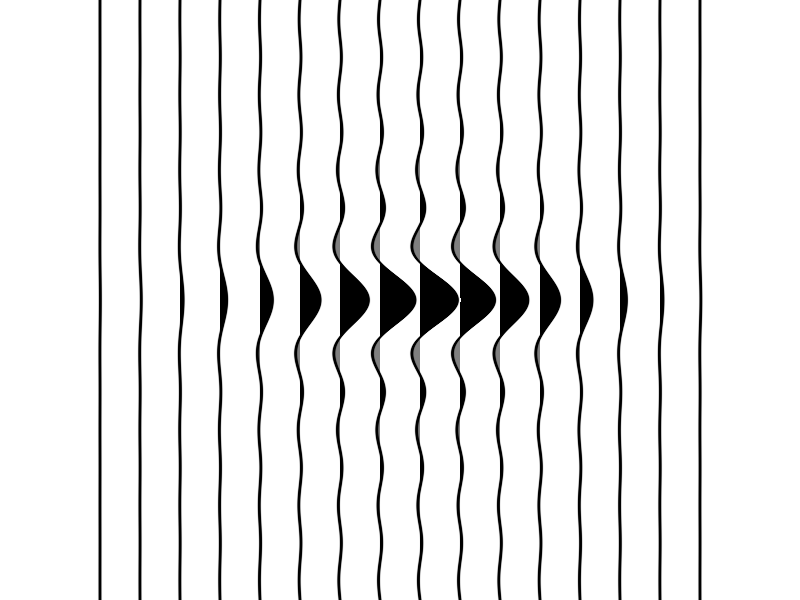
The Wiggle visual displays multichannel time series data (such as seismic traces) using a traditional wiggle plot format. Each channel is plotted as a waveform offset vertically, with filled positive and/or negative areas.
Overview
- Displays multichannel time series (e.g. seismograms, electrophysiology)
- Encoded as a 2D texture:
(channels, samples) - Each row is rendered as a horizontally-scaled waveform
- Positive and negative areas can be filled with separate colors
- Highly efficient GPU rendering using a single texture
When to use
Use the wiggle visual when:
- You want to render dense multichannel waveform data (e.g., seismic traces)
- You need a compact and interactive time series overview
- You want to distinguish positive/negative lobes with color fill
- You prefer classic geophysical wiggle plotting
Properties
Per-visual (uniform)
| Parameter | Type | Description |
|---|---|---|
bounds |
((float, float), (float, float)) |
2D bounds in NDC coordinates (xmin, xmax), (ymin, ymax) |
xrange |
(float, float) |
Horizontal range |
scale |
float |
Scale factor for amplitude |
negative_color |
(4,) uint8 |
Fill color for negative lobes in RGBA |
positive_color |
(4,) uint8 |
Fill color for positive lobes in RGBA |
edgecolor |
(4,) uint8 |
Line color for outlines in RGBA |
texture |
Texture |
2D float32 texture with shape (channels, samples) |
Note
The visual expects the input texture to be a 2D array of shape (channels, samples). Each channel corresponds to a vertically aligned trace. Linear interpolation leads to smoother wiggle plots.
Bounds and xrange
Use bounds to control the position and size of the wiggle plot in Normalized Device Coordinates (NDC). Internally, the plot is rendered on a rectangular quad (composed of two triangles and six vertices), with the wiggle waveform computed in real time by the fragment shader—executed in parallel for each pixel. The bounds define the full 2D extent of the visual on screen.
Use xrange to specify the horizontal domain of the time series, in normalized coordinates (e.g., (0, 1) spans the entire width of the plot).
Colors
The wiggle visual can fill waveform lobes with distinct colors depending on polarity.
positive_color: used to fill regions above zeronegative_color: used to fill regions below zeroedgecolor: optional line trace on top of filled wiggle
Scale
The scale attribute controls the amplitude of the waveforms. Using scale = 1 means a texture value of 1 will correspond to the horizontal spacing between two consecutive channels.
Example
import numpy as np

import datoviz as dvz


def load_data(channels, samples):
    """Create a texture with the given number of channels and samples."""
    c0 = channels / 2.0
    alpha = 2 * np.pi * 8
    beta = 1.0

    s = np.linspace(0, 1, samples)
    x = s - 0.5
    y = np.sinc(alpha * x / np.pi)

    c = np.arange(channels).reshape(-1, 1)
    gamma = np.exp(-beta * ((2 * (c - c0) / c0) ** 2))

    texdata = gamma * y
    return texdata.astype(np.float32).reshape((channels, samples))


channels = 16
samples = 1024

data = load_data(channels, samples)
height, width = data.shape

position = np.array([[0, 0, 0]], dtype=np.float32)
size = np.array([[width, height]], dtype=np.float32)
anchor = np.array([[0, 0]], dtype=np.float32)
texcoords = np.array([[0, 0, 1, 1]], dtype=np.float32)

app = dvz.App()
figure = app.figure(gui=True)
panel = figure.panel()
panzoom = panel.panzoom()

visual = app.wiggle(
    scale=1.0,
    negative_color=(128, 128, 128, 255),
    positive_color=(0, 0, 0, 255),
    edgecolor=(0, 0, 0, 255),
)
texture = app.texture_2D(data, interpolation='linear')
visual.set_texture(texture)
panel.add(visual)


scale = dvz.Out(1.0)


@app.connect(figure)
def on_gui(ev):
    dvz.gui_pos(dvz.vec2(10, 10), dvz.vec2(0, 0))
    dvz.gui_size(dvz.vec2(200, 70))
    dvz.gui_begin('Change the scale', 0)
    has_changed = False
    has_changed |= dvz.gui_slider('scale', 0.1, 5, scale)
    dvz.gui_end()

    if has_changed:
        visual.set_scale(scale.value)


app.run()
app.destroy()
This example creates a synthetic dataset with 16 channels and 1024 samples, maps it to a texture, and displays the wiggle visual with GUI control for scale.
Summary
The Wiggle visual provides an efficient and interactive way to visualize dense multichannel time series using the classic wiggle plot style.
- ✔️ Fast GPU rendering from 2D textures
- ✔️ Separate fill colors for positive/negative values
- ✔️ Adjustable scale, range, and bounds
- ✔️ Ideal for seismic or electrophysiology data
See also: