How to use the scene C API
This example shows how to make a scatter plot using the scene C API in a standalone application.
Note
A basic build script is provided in the examples/ folder. A better practice would probably be to use cmake but this is not documented yet. Help appreciated!
Full source code
// code from `examples/standalone/standalone_scene.c`:
/*************************************************************************************************/
/* Example of a standalone application using the library. */
/*************************************************************************************************/
/// We import the library public header. The compiler needs to be passed the path to the headers
/// and shared library, see build.sh.
#include <datoviz/datoviz.h>
// Entry point.
int main(int argc, char** argv)
{
// We create a singleton application using the GLFW backend.
DvzApp* app = dvz_app(DVZ_BACKEND_GLFW);
// We automatically choose the most capable GPU.
DvzGpu* gpu = dvz_gpu_best(app);
// We create a new canvas with the size specified. The last argument is for optional flags.
DvzCanvas* canvas = dvz_canvas(gpu, 1024, 768, 0);
// We use a white background color (RGB floating-point values in [0, 1]).
dvz_canvas_clear_color(canvas, 1, 1, 1);
// We create a scene, which allows us to define several subplots (panels) organized within a
// grid. Here, we just use a single panel spanning the entire canvas.
DvzScene* scene = dvz_scene(canvas, 1, 1);
// We get the panel at row 0, column 0, and we initialize it with an axes 2D controller.
// The last argument is for optional flags.
DvzPanel* panel = dvz_scene_panel(scene, 0, 0, DVZ_CONTROLLER_AXES_2D, 0);
// We add a new "marker" visual in the panel.
// The last argument is for optional flags.
DvzVisual* visual = dvz_scene_visual(panel, DVZ_VISUAL_MARKER, 0);
// Visual data.
{
// We prepare the data for the marker visual:
// - marker positions (three double-precision floating point numbers for x, y, z)
// - marker colors (four bytes for the RGBA value)
// - marker sizes (a single precision floating point number with the marker size, in
// pixels).
// The visual reference guide provides all supported props.
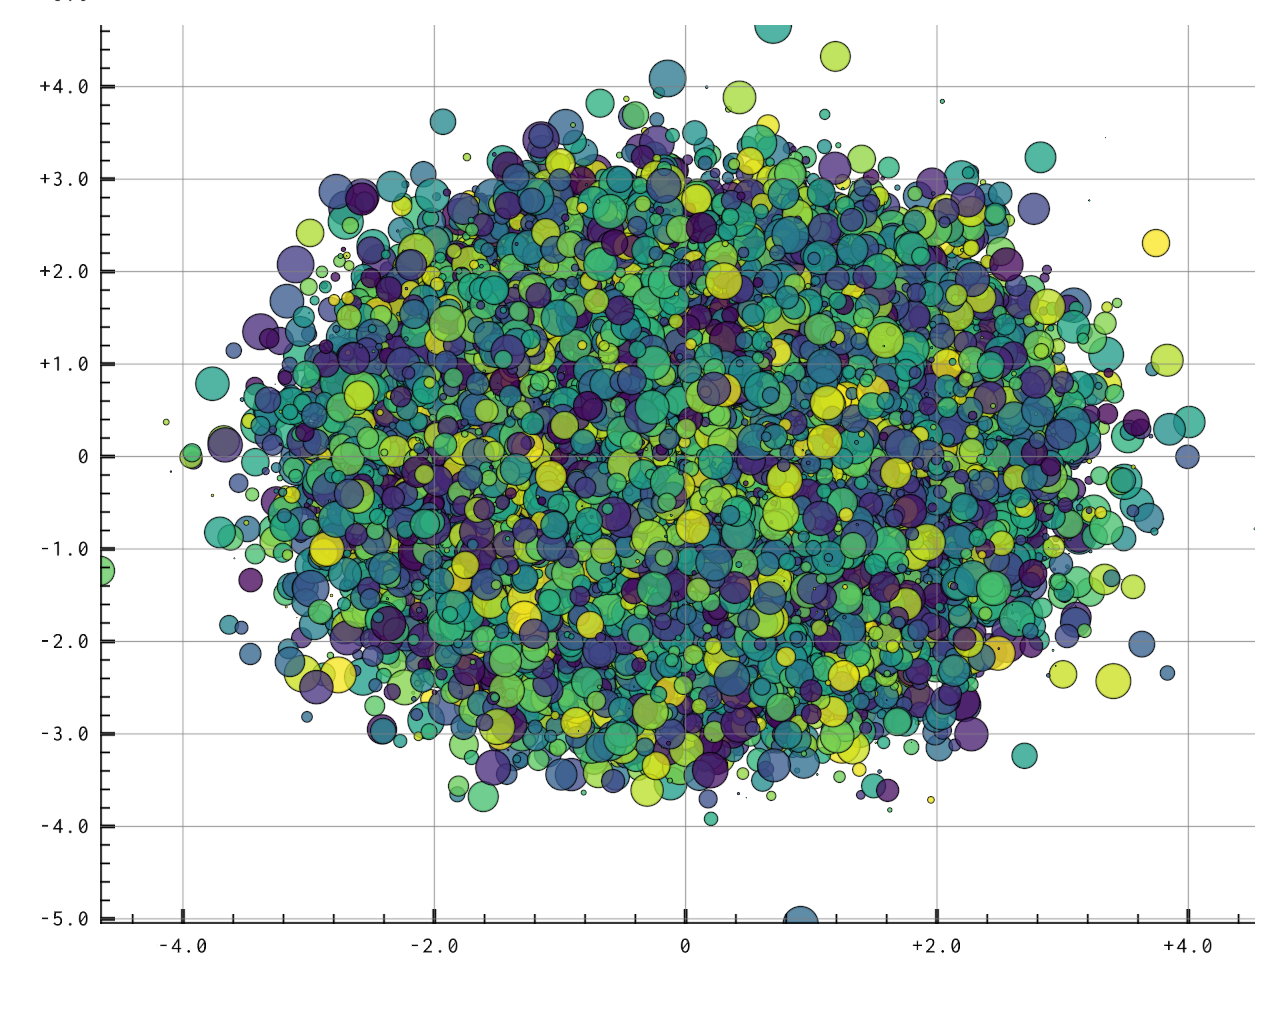
const uint32_t N = 10000;
dvec3* pos = (dvec3*)calloc(N, sizeof(dvec3));
cvec4* color = (cvec4*)calloc(N, sizeof(cvec4));
float* size = (float*)calloc(N, sizeof(float));
for (uint32_t i = 0; i < N; i++)
{
// Random gaussian position.
pos[i][0] = dvz_rand_normal();
pos[i][1] = dvz_rand_normal();
// Color: random value with a colormap.
dvz_colormap_scale(DVZ_CMAP_VIRIDIS, dvz_rand_float(), 0, 1, color[i]);
// A bit of transparency via the alpha channel.
color[i][3] = 196;
// Random marker size.
size[i] = 2 + 38 * dvz_rand_float();
}
// We pass our data to the visual props.
dvz_visual_data(visual, DVZ_PROP_POS, 0, N, pos);
dvz_visual_data(visual, DVZ_PROP_COLOR, 0, N, color);
dvz_visual_data(visual, DVZ_PROP_MARKER_SIZE, 0, N, size);
// We free the memory of the arrays we've created.
FREE(pos);
FREE(color);
FREE(size);
}
// We run the application. The last argument is the number of frames to run, or 0 for infinite
// loop (stop when escape is pressed or when the window is closed).
dvz_app_run(app, 0);
// We need to clean up all objects handled by Datoviz at the end.
dvz_app_destroy(app);
return 0;
}