Axis Labels
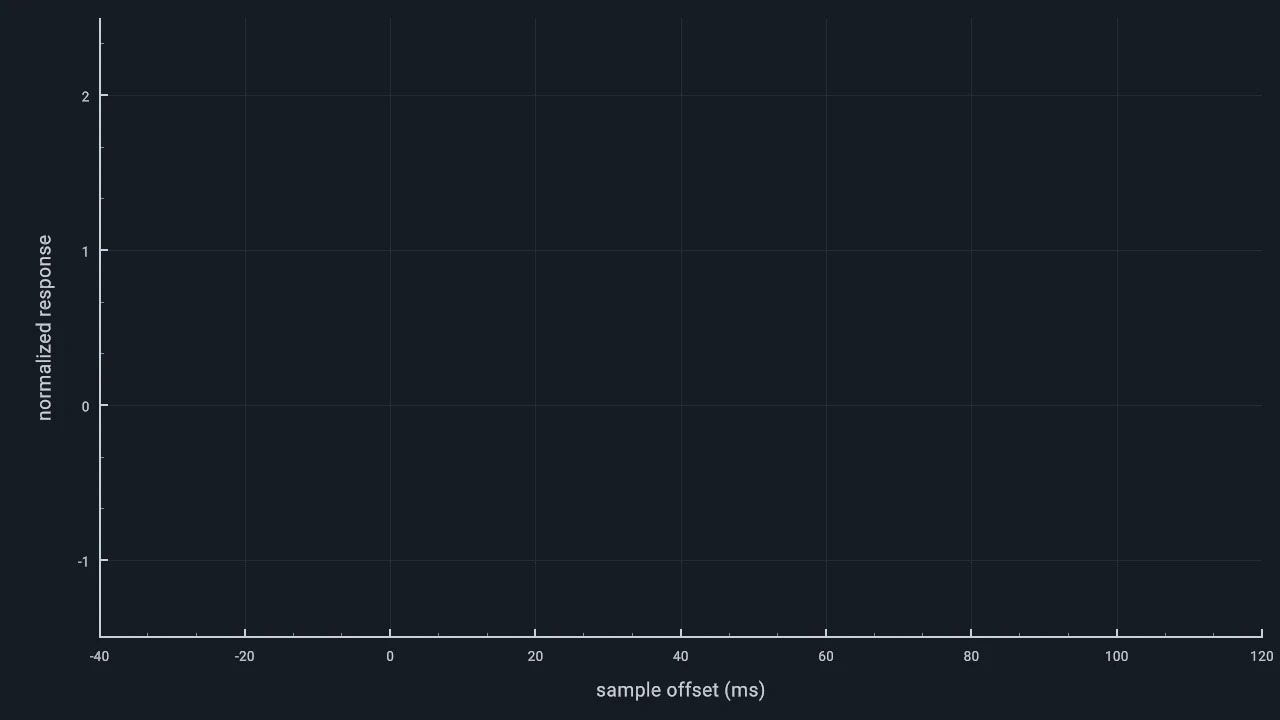
This example shows axis titles and tick-label layout around a plotting panel.
Preview
Run And Adapt
Commands below assume a Datoviz source checkout and start at the repository root. Use your configured build environment; Python routes additionally require local bindings.
| Route | Availability | Command or action |
|---|---|---|
| C | Canonical native source | just example-c features/axis_labels (build and run), or rerun ./build/examples/c/features/axis_labels |
| Python | Available; direct-engine adaptation | python3 -m examples.python.gallery.features.axis_labels |
| Browser | Live WebGPU route | Open live example |
This example is approved as a starting point for user code and coding agents. Keep the object lifetimes and data shapes intact while adapting the data and styling.
What To Look For
The panel has explicit x and y domains, matching tick policies, grid lines, and labels for "sample offset (ms)" and "normalized response". The example is intentionally sparse so the screenshot highlights margins, label offsets, and tick-label readability. This is useful when preparing plots where the axes carry units and must leave enough room for readable scientific labels.
Source
#!/usr/bin/env python3
"""Axis titles and tick-label layout around an empty plotting panel."""

from __future__ import annotations

import ctypes

import datoviz as dvz

from examples.python.gallery import common as ex


def _configure_axis(axis, label: bytes) -> None:
    ticks = dvz.dvz_axis_tick_policy()
    ticks.target_count = 5
    ticks.min_pixel_spacing = 150.0
    ticks.minor_per_interval = 2
    if dvz.dvz_axis_set_tick_policy(axis, ctypes.byref(ticks)) != 0:
        raise RuntimeError("dvz_axis_set_tick_policy() failed")

    style = dvz.dvz_axis_style()
    style.tick_size_px = 14.0
    style.label_size_px = 20.0
    style.tick_gap_px = 10.0
    style.grid_color[:] = (116, 132, 148, 130)
    if dvz.dvz_axis_set_style(axis, ctypes.byref(style)) != 0:
        raise RuntimeError("dvz_axis_set_style() failed")

    if dvz.dvz_axis_set_grid(axis, True) != 0:
        raise RuntimeError("dvz_axis_set_grid() failed")
    if dvz.dvz_axis_set_label(axis, label) != 0:
        raise RuntimeError("dvz_axis_set_label() failed")


def main() -> None:
    scene, figure, panel = ex.scene_panel()
    if dvz.dvz_panel_set_domain(panel, dvz.DVZ_DIM_X, -40.0, 120.0) != 0:
        raise RuntimeError("dvz_panel_set_domain(X) failed")
    if dvz.dvz_panel_set_domain(panel, dvz.DVZ_DIM_Y, -1.5, 2.5) != 0:
        raise RuntimeError("dvz_panel_set_domain(Y) failed")

    x_axis = dvz.dvz_panel_axis(panel, dvz.DVZ_DIM_X)
    y_axis = dvz.dvz_panel_axis(panel, dvz.DVZ_DIM_Y)
    if not x_axis or not y_axis:
        raise RuntimeError("dvz_panel_axis() failed")

    _configure_axis(x_axis, b"sample offset (ms)")
    _configure_axis(y_axis, b"normalized response")

    ex.run(scene, figure, "Axis Labels")


if __name__ == "__main__":
    main()
/*
 * Copyright (c) 2021 Cyrille Rossant and contributors. All rights reserved.
 * Licensed under the MIT license. See LICENSE file in the project root for details.
 * SPDX-License-Identifier: MIT
 */

/* axis_labels - This example shows axis titles and tick-label layout around a plotting panel.
 *
 * Scenario: features_axis_labels
 * Style: features, graphite_cyan, 1280x720 window target
 *
 * Build:  just example-c features/axis_labels
 * Run:    ./build/examples/c/features/axis_labels --live
 * Smoke:  ./build/examples/c/features/axis_labels --png
 *
 * What to look for: the panel has explicit x and y domains, matching tick policies, grid lines,
 * and labels for "sample offset (ms)" and "normalized response". The example is intentionally
 * sparse so the screenshot highlights margins, label offsets, and tick-label readability. This is
 * useful when preparing plots where the axes carry units and must leave enough room for readable
 * scientific labels.
 */


/*************************************************************************************************/
/*  Includes                                                                                     */
/*************************************************************************************************/

#include <stdbool.h>
#include <stdint.h>

#include "_assertions.h"
#include "datoviz/scene.h"
#include "example_style.h"
#include "runner/scenario_runner.h"


/*************************************************************************************************/
/*  Forward declarations                                                                         */
/*************************************************************************************************/

DvzScenarioSpec dvz_example_axis_labels_scenario(void);


/*************************************************************************************************/
/*  Constants                                                                                    */
/*************************************************************************************************/

#define WIDTH  EXAMPLE_WINDOW_WIDTH
#define HEIGHT EXAMPLE_WINDOW_HEIGHT
#define SEGMENT_COUNT 4u


/*************************************************************************************************/
/*  Scenario callbacks                                                                           */
/*************************************************************************************************/

/**
 * Initialize the axis label placement scenario.
 *
 * @param ctx scenario context
 * @param out_user scenario state output
 * @return true on success
 */
static bool _scenario_init(DvzScenarioContext* ctx, void** out_user)
{
    if (ctx == NULL)
        return false;
    if (out_user != NULL)
        *out_user = NULL;

    ctx->figure = dvz_figure(ctx->scene, ctx->width, ctx->height, 0);
    if (ctx->figure == NULL)
        return false;

    DvzPanel* panel = dvz_panel_full(ctx->figure);
    if (panel == NULL)
        return false;
    example_graphite_cyan_set_panel_background(panel);

    if (dvz_panel_set_domain(panel, DVZ_DIM_X, -40.0, 120.0) != 0)
        return false;
    if (dvz_panel_set_domain(panel, DVZ_DIM_Y, -1.5, 2.5) != 0)
        return false;

    DvzAxis* x_axis = dvz_panel_axis(panel, DVZ_DIM_X);
    DvzAxis* y_axis = dvz_panel_axis(panel, DVZ_DIM_Y);
    if (x_axis == NULL || y_axis == NULL)
        return false;

    DvzAxisTickPolicy ticks = dvz_axis_tick_policy();
    ticks.target_count = 5;
    ticks.min_pixel_spacing = 150.0f;
    ticks.minor_per_interval = 2;
    if (dvz_axis_set_tick_policy(x_axis, &ticks) != DVZ_OK)
        return false;
    if (dvz_axis_set_tick_policy(y_axis, &ticks) != DVZ_OK)
        return false;

    ExampleAxisStyleOptions style = example_graphite_cyan_axis_options();
    style.tick_size_px = 14.0f;
    style.label_size_px = 20.0f;
    style.tick_gap_px = 10.0f;
    style.grid_alpha = 130u;
    if (!example_graphite_cyan_apply_axis_style(x_axis, false, &style))
        return false;
    if (!example_graphite_cyan_apply_axis_style(y_axis, true, &style))
        return false;

    if (dvz_axis_set_grid(x_axis, true) != DVZ_OK)
        return false;
    if (dvz_axis_set_grid(y_axis, true) != DVZ_OK)
        return false;
    if (dvz_axis_set_label(x_axis, "sample offset (ms)") != DVZ_OK)
        return false;
    if (dvz_axis_set_label(y_axis, "normalized response") != DVZ_OK)
        return false;

    return true;
}


/**
 * Return the axis-labels scenario specification.
 *
 * @return scenario specification
 */
DvzScenarioSpec dvz_example_axis_labels_scenario(void)
{
    return (DvzScenarioSpec){
        .id = "features_axis_labels",
        .title = "Axis Labels",
        .width = WIDTH,
        .height = HEIGHT,
        .fps = 60.0,
        .requirements = DVZ_SCENARIO_REQ_TEXT_VISUAL,
        .init = _scenario_init,
    };
}


/*************************************************************************************************/
/*  Functions                                                                                    */
/*************************************************************************************************/

/**
 * Run the axis label placement feature example through the native scenario runner.
 *
 * @param argc command-line argument count
 * @param argv command-line argument vector
 * @return process exit code
 */
#ifndef DVZ_EXAMPLE_NO_MAIN
int main(int argc, char** argv)
{
    DvzScenarioSpec spec = dvz_example_axis_labels_scenario();
    return dvz_scenario_run_native_cli(&spec, argc, argv) == 0 ? 0 : 1;
}
#endif
Example details
- ID:
features_axis_labels - Category:
feature - Lane:
features - Status:
supported - Source:
examples/c/features/axis_labels.c - Approved adaptation starter:
yes - Python source:
examples/python/gallery/features/axis_labels.py - Python adaptation: Available; direct-engine adaptation
- Browser support: Live in browser
- WebGPU live route:
examples/webgpu/live.html?id=features_axis_labels - Browser capability tags:
axes,text,labels - Validation:
smoke+screenshot
Data
| Field | Value |
|---|---|
kind |
synthetic |