Colorbar
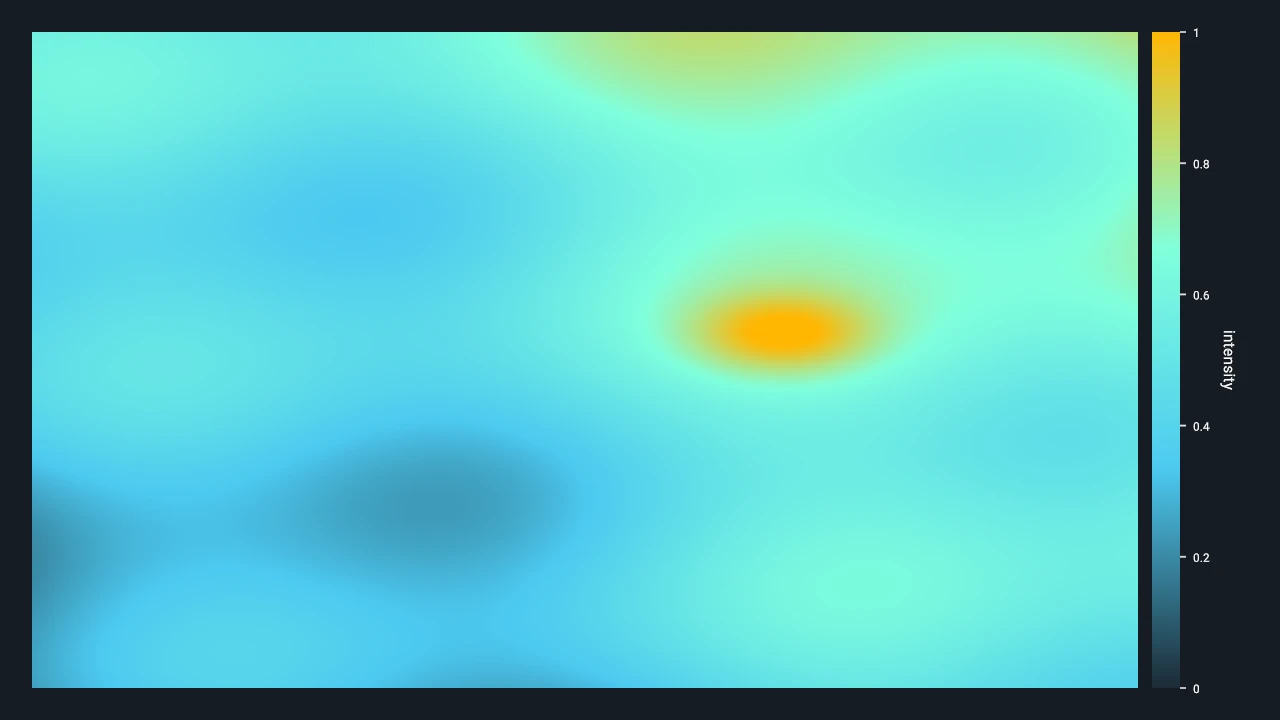
This example shows a scalar image and a continuous colorbar.
Preview
Run And Adapt
Commands below assume a Datoviz source checkout and start at the repository root. Use your configured build environment; Python routes additionally require local bindings.
| Route | Availability | Command or action |
|---|---|---|
| C | Canonical native source | just example-c features/colorbar (build and run), or rerun ./build/examples/c/features/colorbar |
| Python | Available; manually maintained direct-engine example | python3 -m examples.python.gallery.features.colorbar |
| Browser | Live WebGPU route | Open live example |
This example is approved as a starting point for user code and coding agents. Keep the object lifetimes and data shapes intact while adapting the data and styling.
What To Look For
A 192 by 144 float field is uploaded as an R32 sampled field, and the image visual maps those scalar samples through a continuous scale with domain 0 to 1. The same scale is passed to the vertical colorbar on the right. Compare image colors with the ramp and tick labels; this is the standard pattern for making heat maps, microscopy images, or simulation fields interpretable by exposing the numeric meaning of color.
Source
#!/usr/bin/env python3
"""Scalar sampled-field image with a retained continuous colorbar."""

from __future__ import annotations

import ctypes

import numpy as np

import datoviz as dvz

from examples.python.gallery import common as ex


def main() -> None:
    scene, figure, panel = ex.scene_panel()
    dvz.dvz_panel_set_domain(panel, dvz.DVZ_DIM_X, 0.0, 1.0)
    dvz.dvz_panel_set_domain(panel, dvz.DVZ_DIM_Y, 0.0, 1.0)

    width, height = 192, 144
    x = np.linspace(0.0, 1.0, width, dtype=np.float32)
    y = np.linspace(0.0, 1.0, height, dtype=np.float32)
    u, v = np.meshgrid(x, y)
    values = 0.18 + 0.35 * u + 0.28 * v
    values += 0.09 * np.sin(2.0 * np.pi * (1.7 * u + 0.25 * v))
    values += 0.34 * np.exp(-(((u - 0.68) ** 2 + 1.8 * (v - 0.54) ** 2) / (2.0 * 0.055**2)))
    values = np.clip(values, 0.0, 1.0).astype(np.float32)

    scale = ex.continuous_scale(scene, b"python_feature_colorbar")
    field = dvz.dvz_sampled_field_from_array(scene, values)
    ex.add_image(scene, panel, field, scale=scale)

    desc = dvz.dvz_colorbar_desc()
    desc.orientation = dvz.DVZ_COLORBAR_ORIENTATION_VERTICAL
    desc.anchor = dvz.DVZ_SCENE_ANCHOR_PANEL_RIGHT
    desc.title = b"intensity"
    desc.reserve_px = 110.0
    desc.ramp_width_px = 28.0
    desc.plot_gap_px = 14.0
    desc.tick_length_px = 6.0
    desc.label_gap_px = 7.0
    colorbar = dvz.dvz_colorbar(panel, scale, ctypes.byref(desc))
    if not colorbar:
        raise RuntimeError("dvz_colorbar() failed")

    ex.run(scene, figure, "Colorbar")


if __name__ == "__main__":
    main()
/*
 * Copyright (c) 2021 Cyrille Rossant and contributors. All rights reserved.
 * Licensed under the MIT license. See LICENSE file in the project root for details.
 * SPDX-License-Identifier: MIT
 */

/* colorbar - This example shows a scalar image and a retained continuous colorbar.
 *
 * Scenario: features_colorbar
 * Style: features, graphite_cyan, 1280x720 window target
 *
 * Build:  just example-c features/colorbar
 * Run:    ./build/examples/c/features/colorbar --live
 * Smoke:  ./build/examples/c/features/colorbar --png
 *
 * What to look for: a 192 by 144 float field is uploaded as an R32 sampled field, and the image
 * visual maps those scalar samples through a continuous scale with domain 0 to 1. The same scale
 * is passed to the vertical colorbar on the right. Compare image colors with the ramp and tick
 * labels; this is the standard pattern for making heat maps, microscopy images, or simulation
 * fields interpretable by exposing the numeric meaning of color.
 */


/*************************************************************************************************/
/*  Includes                                                                                     */
/*************************************************************************************************/

#include <math.h>
#include <stdbool.h>
#include <stdint.h>

#include "_alloc.h"
#include "_assertions.h"
#include "datoviz/scene.h"
#include "example_style.h"
#include "runner/scenario_runner.h"


DvzScenarioSpec dvz_example_colorbar_scenario(void);


/*************************************************************************************************/
/*  Constants                                                                                    */
/*************************************************************************************************/

#define WIDTH  EXAMPLE_WINDOW_WIDTH
#define HEIGHT EXAMPLE_WINDOW_HEIGHT
#define FIELD_WIDTH  192u
#define FIELD_HEIGHT 144u

static const float TAU = 6.28318530718f;


/*************************************************************************************************/
/*  Structs                                                                                      */
/*************************************************************************************************/

typedef struct ColorbarState
{
    float values[FIELD_WIDTH * FIELD_HEIGHT];
} ColorbarState;


/*************************************************************************************************/
/*  Helpers                                                                                      */
/*************************************************************************************************/

/**
 * Clamp a float to the unit interval.
 *
 * @param value input value
 * @return clamped value
 */
static float _clamp01(float value)
{
    if (value < 0.0f)
        return 0.0f;
    if (value > 1.0f)
        return 1.0f;
    return value;
}


/**
 * Return one deterministic scalar sample.
 *
 * @param x normalized X coordinate
 * @param y normalized Y coordinate
 * @return normalized scalar value
 */
static float _sample_scalar(float x, float y)
{
    float value = 0.18f + 0.35f * x + 0.28f * y;
    value += 0.09f * sinf(TAU * (1.7f * x + 0.25f * y));
    value += 0.07f * cosf(TAU * (0.4f * x - 2.2f * y));

    const float dx = x - 0.68f;
    const float dy = y - 0.54f;
    value += 0.34f * expf(-(dx * dx + 1.8f * dy * dy) / (2.0f * 0.055f * 0.055f));

    return _clamp01(value);
}


/**
 * Fill the scalar field backing the image.
 *
 * @param values output normalized scalar samples
 */
static void _fill_field(float values[FIELD_WIDTH * FIELD_HEIGHT])
{
    ANN(values);

    for (uint32_t y = 0; y < FIELD_HEIGHT; y++)
    {
        for (uint32_t x = 0; x < FIELD_WIDTH; x++)
        {
            const float u = FIELD_WIDTH > 1u ? (float)x / (float)(FIELD_WIDTH - 1u) : 0.0f;
            const float v = FIELD_HEIGHT > 1u ? (float)y / (float)(FIELD_HEIGHT - 1u) : 0.0f;
            values[y * FIELD_WIDTH + x] = _sample_scalar(u, v);
        }
    }
}


/**
 * Create the continuous scale shared by the image and colorbar.
 *
 * @param scene scene owning scale resources
 * @return created scale, or NULL on failure
 */
static DvzScale* _add_scale(DvzScene* scene)
{
    ANN(scene);

    DvzScale* scale = dvz_scale(
        scene, &(DvzScaleDesc){DVZ_STRUCT_INIT_FIELDS(DvzScaleDesc),
                   .kind = DVZ_SCALE_CONTINUOUS,
                   .label = "intensity",
               });
    if (scale == NULL)
        return NULL;
    dvz_scale_set_format(
        scale, &(DvzFormatDesc){DVZ_STRUCT_INIT_FIELDS(DvzFormatDesc),
                   .precision = 2,
                   .trim_trailing_zeros = true});

    dvz_scale_set_domain(scale, 0.0, 1.0);
    dvz_scale_set_view_range(scale, 0.0, 1.0);

    DvzColormap* colormap = example_graphite_cyan_colormap(scene);
    if (colormap == NULL)
        return NULL;
    dvz_scale_set_colormap(scale, colormap);
    return scale;
}


/**
 * Add one scalar image used as the colorbar's visual referent.
 *
 * @param scene scene owning the visual
 * @param panel panel receiving the visual
 * @param scale color scale bound to the image
 * @param values scalar field values
 * @return true when the image was added
 */
static bool
_add_scalar_image(DvzScene* scene, DvzPanel* panel, DvzScale* scale, float* values)
{
    ANN(scene);
    ANN(panel);
    ANN(scale);
    ANN(values);

    vec3 data_positions[4] = {
        {0.0f, 0.0f, 0.0f},
        {0.0f, 1.0f, 0.0f},
        {1.0f, 0.0f, 0.0f},
        {1.0f, 1.0f, 0.0f},
    };
    vec2 texcoords[4] = {
        {0.0f, 0.0f},
        {0.0f, 1.0f},
        {1.0f, 0.0f},
        {1.0f, 1.0f},
    };

    DvzVisual* image = dvz_image(scene, 0);
    if (image == NULL)
        return false;
    if (dvz_visual_set_data(image, "position", data_positions, 4) != 0)
        return false;
    if (dvz_visual_set_data(image, "texcoords", texcoords, 4) != 0)
        return false;
    if (dvz_visual_set_scale(image, "color", scale) != 0)
        return false;

    DvzSampledField* field = dvz_sampled_field(
        scene, &(DvzSampledFieldDesc){DVZ_STRUCT_INIT_FIELDS(DvzSampledFieldDesc),
                   .dim = DVZ_FIELD_DIM_2D,
                   .format = DVZ_FIELD_FORMAT_R32_FLOAT,
                   .semantic = DVZ_FIELD_SEMANTIC_SCALAR,
                   .width = FIELD_WIDTH,
                   .height = FIELD_HEIGHT,
                   .depth = 1,
               });
    if (field == NULL)
        return false;
    if (dvz_sampled_field_set_data(
            field, &(DvzFieldDataView){DVZ_STRUCT_INIT_FIELDS(DvzFieldDataView),
                       .data = values,
                       .bytes_per_row = FIELD_WIDTH * sizeof(float),
                       .rows_per_image = FIELD_HEIGHT,
                   }) != DVZ_OK)
    {
        return false;
    }
    if (dvz_visual_set_field(image, "field", field) != DVZ_OK)
        return false;
    if (dvz_visual_set_depth_test(image, false) != 0)
        return false;
    return dvz_panel_add_visual(panel, image, NULL) == 0;
}


/*************************************************************************************************/
/*  Scenario callbacks                                                                           */
/*************************************************************************************************/

/**
 * Initialize the deterministic retained colorbar scenario.
 *
 * @param ctx scenario context
 * @param out_user scenario state output
 * @return true on success
 */
static bool _scenario_init(DvzScenarioContext* ctx, void** out_user)
{
    if (ctx == NULL || out_user == NULL)
        return false;

    ColorbarState* state = (ColorbarState*)dvz_calloc(1, sizeof(ColorbarState));
    if (state == NULL)
        return false;

    _fill_field(state->values);

    ctx->figure = dvz_figure(ctx->scene, ctx->width, ctx->height, 0);
    if (ctx->figure == NULL)
        goto error;

    DvzPanel* panel = dvz_panel_full(ctx->figure);
    if (panel == NULL)
        goto error;
    example_graphite_cyan_set_panel_background(panel);

    int rc = dvz_panel_set_domain(panel, DVZ_DIM_X, 0.0, 1.0);
    if (rc != 0)
        goto error;
    rc = dvz_panel_set_domain(panel, DVZ_DIM_Y, 0.0, 1.0);
    if (rc != 0)
        goto error;

    DvzScale* scale = _add_scale(ctx->scene);
    if (scale == NULL)
        goto error;

    bool ok = _add_scalar_image(ctx->scene, panel, scale, state->values);
    if (!ok)
        goto error;

    DvzColorbar* colorbar = dvz_colorbar(
        panel, scale,
        &(DvzColorbarDesc){DVZ_STRUCT_INIT_FIELDS(DvzColorbarDesc),
            .orientation = DVZ_COLORBAR_ORIENTATION_VERTICAL,
            .anchor = DVZ_SCENE_ANCHOR_PANEL_RIGHT,
            .title = "intensity",
            .reserve_px = 110.0f,
            .ramp_width_px = 28.0f,
            .plot_gap_px = 14.0f,
            .tick_length_px = 6.0f,
            .label_gap_px = 7.0f,
        });
    if (colorbar == NULL)
        goto error;
    dvz_colorbar_set_format(
        colorbar, &(DvzFormatDesc){DVZ_STRUCT_INIT_FIELDS(DvzFormatDesc),
                      .precision = 2,
                      .trim_trailing_zeros = true});

    *out_user = state;
    return true;

error:
    dvz_free(state);
    return false;
}


/**
 * Destroy the deterministic retained colorbar scenario.
 *
 * @param ctx scenario context
 * @param user scenario state
 */
static void _scenario_destroy(DvzScenarioContext* ctx, void* user)
{
    (void)ctx;
    dvz_free(user);
}


/**
 * Return the colorbar scenario specification.
 *
 * @return scenario specification
 */
DvzScenarioSpec dvz_example_colorbar_scenario(void)
{
    return (DvzScenarioSpec){
        .id = "features_colorbar",
        .title = "Colorbar",
        .width = WIDTH,
        .height = HEIGHT,
        .fps = 60.0,
        .requirements = DVZ_SCENARIO_REQ_IMAGE_VISUAL | DVZ_SCENARIO_REQ_TEXT_VISUAL,
        .init = _scenario_init,
        .destroy = _scenario_destroy,
    };
}


/*************************************************************************************************/
/*  Functions                                                                                    */
/*************************************************************************************************/

/**
 * Run the deterministic retained colorbar feature proof through the native scenario runner.
 *
 * @param argc command-line argument count
 * @param argv command-line argument vector
 * @return process exit code
 */
#ifndef DVZ_EXAMPLE_NO_MAIN
int main(int argc, char** argv)
{
    DvzScenarioSpec spec = dvz_example_colorbar_scenario();
    return dvz_scenario_run_native_cli(&spec, argc, argv) == 0 ? 0 : 1;
}
#endif
Example details
- ID:
features_colorbar - Category:
feature - Lane:
features - Status:
supported - Source:
examples/c/features/colorbar.c - Approved adaptation starter:
yes - Python source:
examples/python/gallery/features/colorbar.py - Python adaptation: Available; manually maintained direct-engine example
- Browser support: Live in browser
- WebGPU live route:
examples/webgpu/live.html?id=features_colorbar - Browser capability tags:
colorbar,image,sampled-field,text - Validation:
smoke+screenshot
Tags
colorbar, scalar-field, image, capture
Data
| Field | Value |
|---|---|
kind |
synthetic |