Add Axes
Add 2D axes, ticks, grid lines, and labels to a panel.
At a glance
Status: Supported retained linear 2D axes · Languages: Python and C Prerequisites: A panel with explicit finite X/Y domains and its data visual Result: Panel-owned ticks, grid lines, and labels that follow the visible data domain
Use this when
- A 2D panel needs numeric X/Y context.
- Panzoom interaction should keep ticks aligned with the visible data range.
- A figure needs axis titles, grid lines, or tuned tick density.
- You need a plotting-style panel rather than a bare scene view.
Use reference grids or orientation gizmos for 3D spatial context. The retained axis helpers described here are for panel-owned 2D X/Y axes.
Minimal sequence
Set the panel data domain first, then request the panel-owned axes and configure their visible parts.
Prerequisite: create a 2D panel and its data visual first. The result is panel-owned X/Y axes
with grid lines and labels. These are setup fragments; see the complete
Path With 2D Axes example.
Python
import datoviz as dvz

dvz.dvz_panel_set_domain(panel, dvz.DVZ_DIM_X, xmin, xmax)
dvz.dvz_panel_set_domain(panel, dvz.DVZ_DIM_Y, ymin, ymax)
x_axis = dvz.dvz_panel_axis(panel, dvz.DVZ_DIM_X)
y_axis = dvz.dvz_panel_axis(panel, dvz.DVZ_DIM_Y)
if not x_axis or not y_axis:
    raise RuntimeError("dvz_panel_axis() failed")
dvz.dvz_axis_set_grid(x_axis, True)
dvz.dvz_axis_set_grid(y_axis, True)
dvz.dvz_axis_set_label(x_axis, b"x")
dvz.dvz_axis_set_label(y_axis, b"y")
C
dvz_panel_set_domain(panel, DVZ_DIM_X, xmin, xmax);
dvz_panel_set_domain(panel, DVZ_DIM_Y, ymin, ymax);

DvzAxis* x_axis = dvz_panel_axis(panel, DVZ_DIM_X);
DvzAxis* y_axis = dvz_panel_axis(panel, DVZ_DIM_Y);
dvz_axis_set_grid(x_axis, true);
dvz_axis_set_grid(y_axis, true);
dvz_axis_set_label(x_axis, "x");
dvz_axis_set_label(y_axis, "y");
Keep axes in the same panel as the data they describe. If the panel uses panzoom, bind the controller to the same X/Y dimensions so ticks, grid lines, and visible data move together.
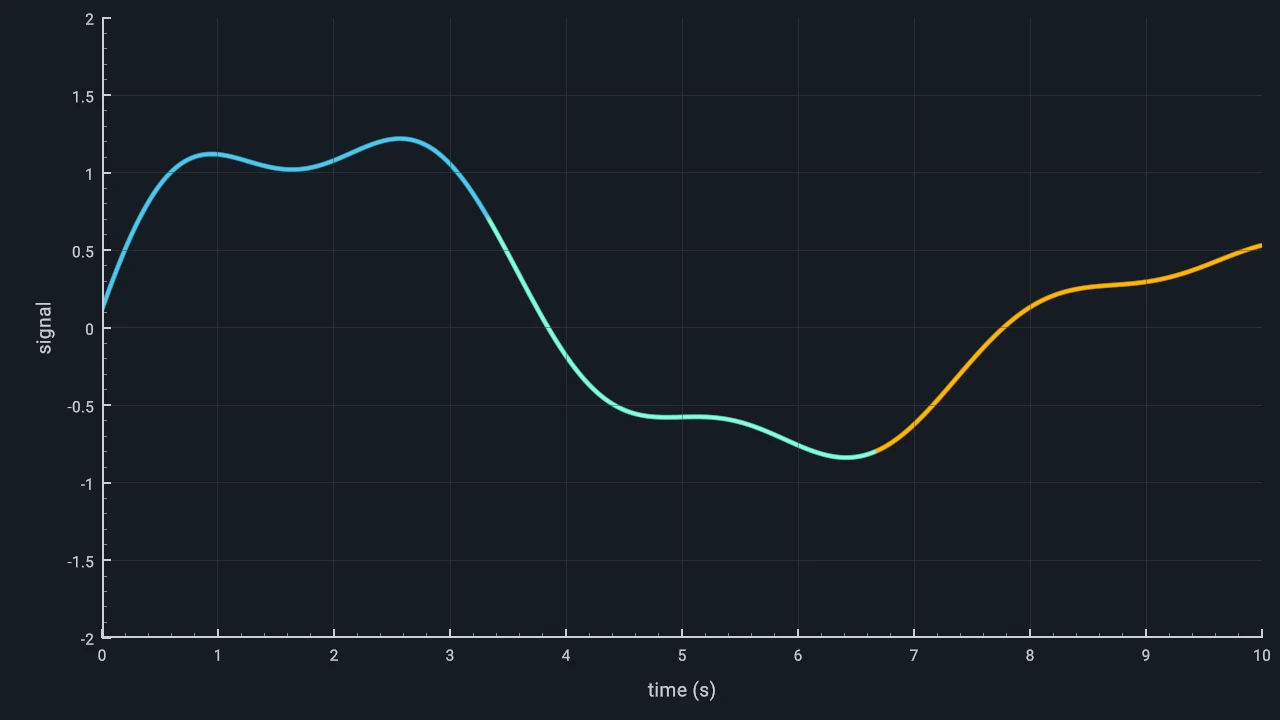
The expected result is one X axis and one Y axis around the panel plot area. Both show automatic ticks and labels; enabling the grid adds lines at the corresponding major ticks.
Domain and coordinates
Axes are derived from the panel data domain. Visual attributes may still need to be uploaded in the coordinate space expected by the visual family. When your source samples are in panel data coordinates, upload those data positions and use the default data-space attachment:
dvz_visual_set_data(visual, "position", data_positions, count);
dvz_panel_add_visual(panel, visual, NULL);
Update the panel domain when the data range changes. If multiple panels are linked, keep their domains and controllers linked intentionally rather than copying tick labels by hand.
Domain endpoints are ordered, not sorted. Reversed finite domains are valid: for example,
dvz_panel_set_domain(panel, DVZ_DIM_X, 10.0, 0.0) maps data value 10.0 to the left edge and
0.0 to the right edge. The same convention applies to Y: the first endpoint maps to the bottom
visual edge and the second endpoint maps to the top visual edge. dvz_panel_visible_domain()
preserves that endpoint order after View2D fitting and panzoom.
Tick policy and labels
Use the default tick policy for ordinary plots. Tune it when labels collide or the panel is small.
DvzAxisTickPolicy ticks = dvz_axis_tick_policy();
ticks.target_count = 5;
ticks.min_pixel_spacing = 150.0f;
ticks.minor_per_interval = 2;
dvz_axis_set_tick_policy(x_axis, &ticks);
dvz_axis_set_tick_policy(y_axis, &ticks);
In Python, descriptor setters keep their exact generated pointer shape:
import ctypes

ticks = dvz.dvz_axis_tick_policy()
ticks.target_count = 5
ticks.min_pixel_spacing = 150.0
ticks.minor_per_interval = 2
dvz.dvz_axis_set_tick_policy(x_axis, ctypes.byref(ticks))
When another layer owns tick selection, use explicit ticks instead of the automatic policy:
double tick_values[] = {10.0, 5.0, 0.0};
const char* tick_labels[] = {"ten", "five", "zero"};
DvzAxisTicks explicit_ticks = {
    DVZ_STRUCT_INIT_FIELDS(DvzAxisTicks),
    .count = 3,
    .values = tick_values,
    .labels = tick_labels,
};
dvz_axis_set_ticks(x_axis, &explicit_ticks);
Explicit tick values are panel data coordinates and render in the order supplied. Datoviz copies
labels before dvz_axis_set_ticks() returns. Passing an empty explicit tick record renders no
ticks, tick labels, or grid lines until dvz_axis_clear_ticks() restores automatic ticks.
Use labels for semantic names and units:
dvz_axis_set_label(x_axis, "time (ms)");
dvz_axis_set_label(y_axis, "normalized response");
For formatted numeric units, attach a DvzUnits object with dvz_axis_set_units(). For compact
data coordinates that should render as absolute UTC time, use dvz_axis_set_datetime() and
dvz_axis_set_datetime_range().
Styling and margins
Axis labels and tick labels need space. If labels crowd the plot edge, reserve plot-area margins or use a larger panel/grid margin.
dvz_axis_set_plot_margins(x_axis, 0.0f, 0.0f, 0.08f, 0.0f);
dvz_axis_set_plot_margins(y_axis, 0.08f, 0.0f, 0.0f, 0.0f);
Use dvz_axis_set_style() when the default tick, text, or grid styling does not match the figure.
Avoid drawing custom axis lines unless the retained axis helper cannot express the intended
annotation.
Browser support
The 2D axes and axis-label examples have live WebGPU routes. Check the generated example page when browser support matters, especially if the scene also uses panzoom or text-heavy annotations.
Canonical examples
- Path With 2D Axes - minimal retained 2D axes and
tick labels on a path plot. Source:
examples/c/features/axes_2d.c. - Axis Labels - axis titles, tick-label
spacing, and plot margins. Source:
examples/c/features/axis_labels.c. - Linked Panels With Axes - linked
panels, axes, and panzoom coordination. Source:
examples/c/showcases/panel_linked_axes.c. - Scientific Plotting Workflow - composed plotting workflow using axes as one part of a larger layout.
Important details
- Axes are panel-owned adornments. Do not share one
DvzAxisacross panels. - The active retained axis path supports finite linear X/Y panel domains. Use separate 3D reference helpers for 3D orientation.
- Axis labels use the same text support as other Datoviz labels, so browser routes need text support.
- Grid lines belong to the axis state. Keep them subtle enough that they do not dominate the data.
- When using colorbars, scale bars, or legends, keep each adornment synchronized with the same data range, units, and panel layout policy.
Common mistakes
- Adding axes before deciding the panel data domain.
- Uploading data-space positions directly when the visual expects visual-space positions.
- Adding axis labels without matching the data units.
- Letting tick labels collide instead of tuning tick policy or margins.
- Showing one axis or label set for panels that are not actually linked.
- Treating a composed scientific plotting showcase as the minimal axes example.
- Drawing custom lines for axes when the axes helper already provides the intended behavior.