Choose a Visual Family
Pick the visual whose primitive and data layout match your task.
At a glance
Status: Built-in families are supported unless their reference page says experimental Languages: The same family constructors and attribute contracts apply in Python and C Input: Geometry, regular fields, labels, or text with known item/grid structure Result: A family choice that preserves batching, coordinates, and scientific meaning
Task workflow
Start from the geometry you have, not from the plot name. Use point or marker for independent 2D samples, path or segment for lines, image or volume for sampled fields, mesh or sphere for 3D surfaces and objects, text for semantic strings, and labels for categorical integer fields.
Choose the coarsest visual family that lets you batch similar elements together. The preferred Datoviz layout is few visuals, many items per visual. Split elements into separate visuals only when they truly need different visual families, materials, transforms, panels, or update schedules.
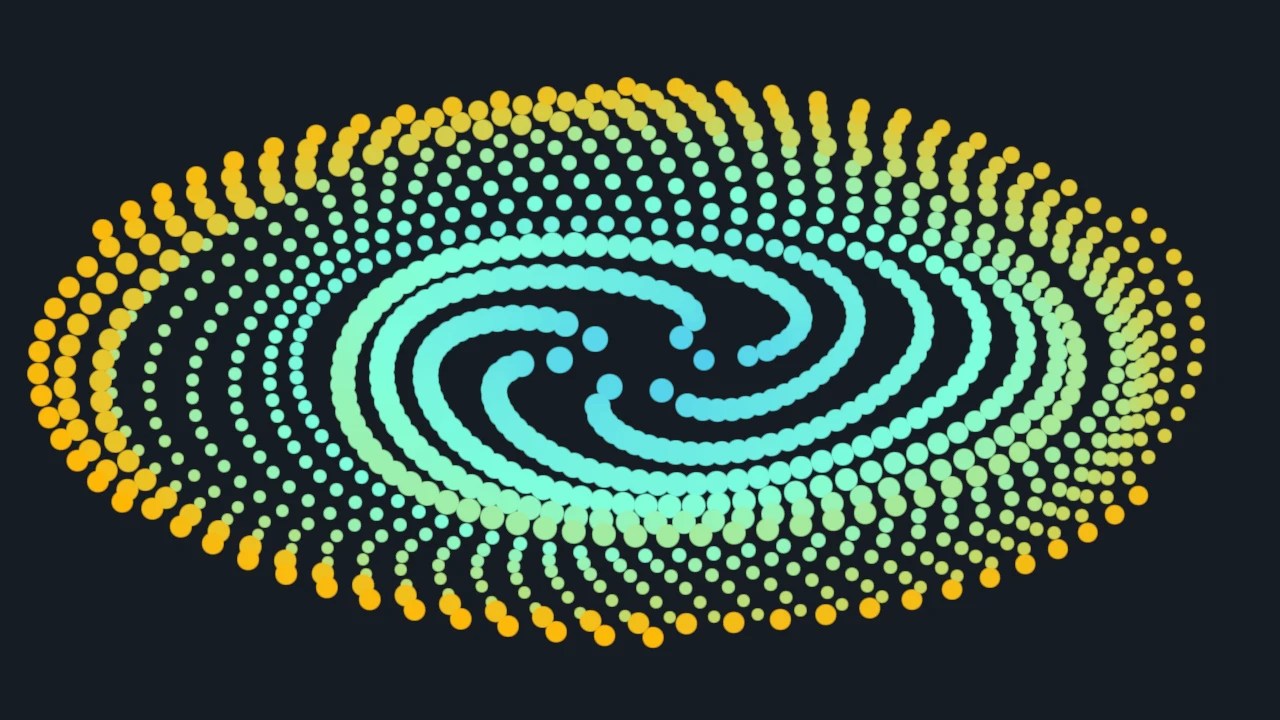
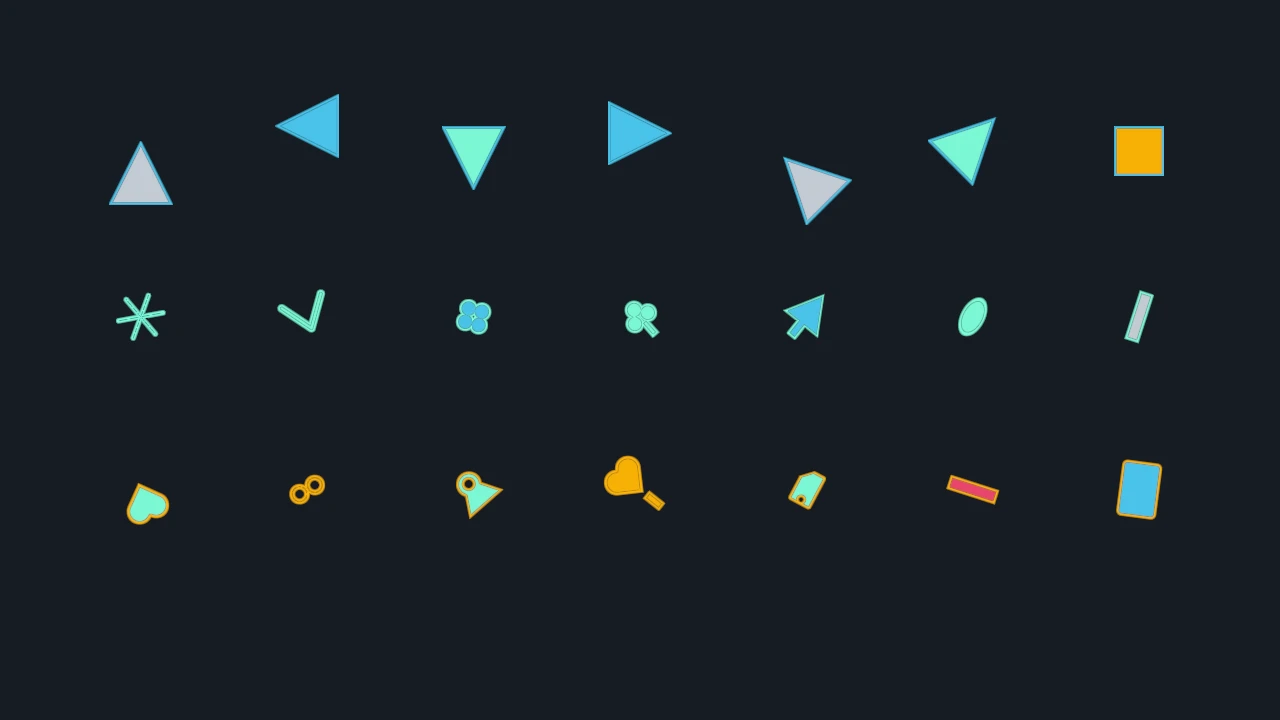
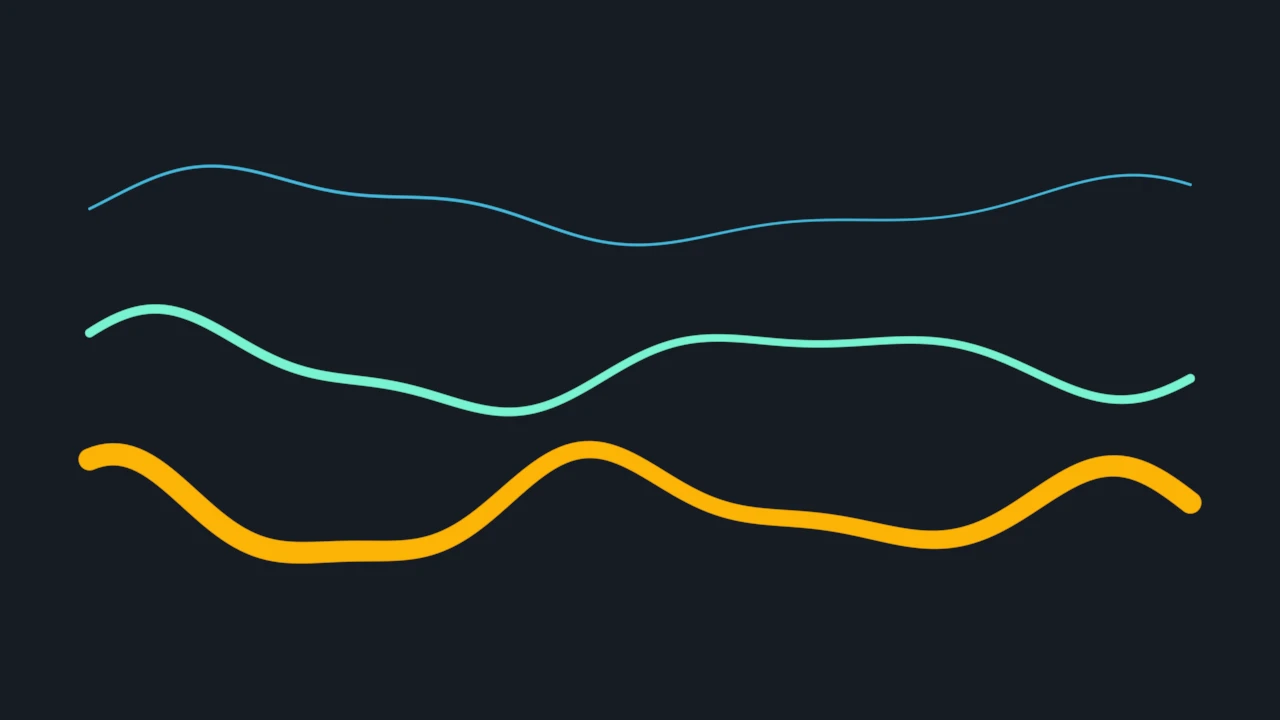
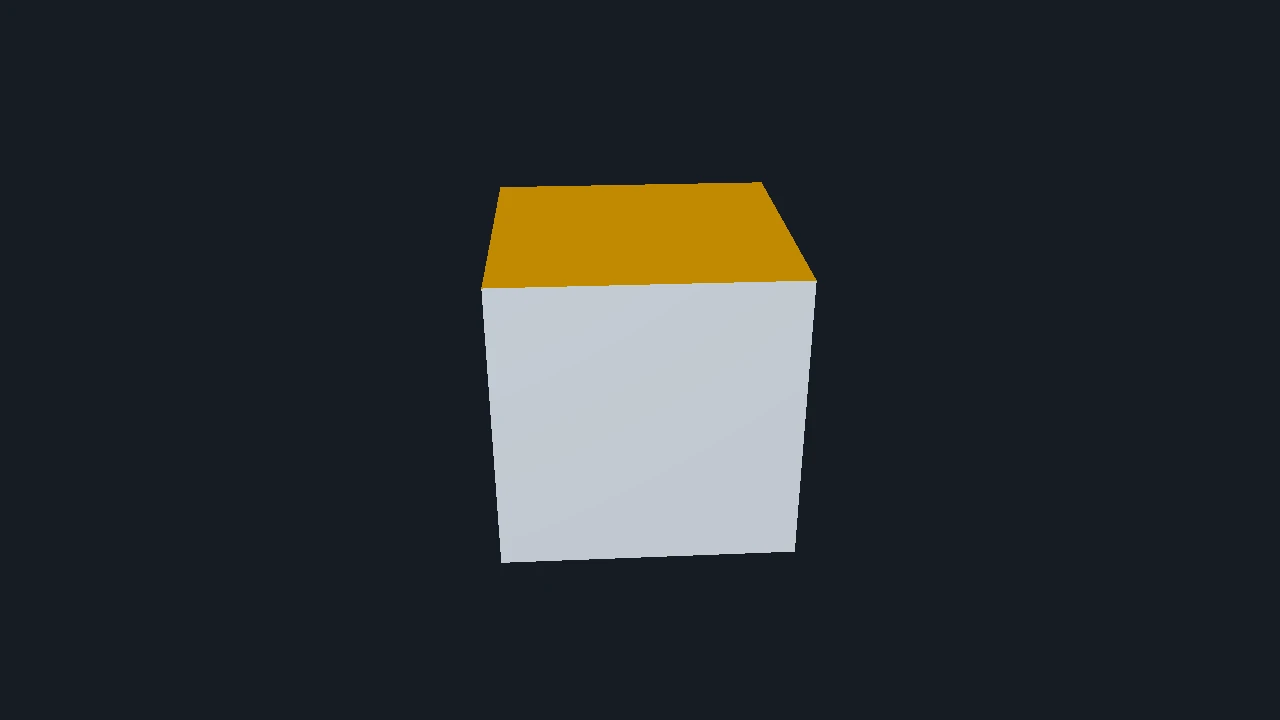
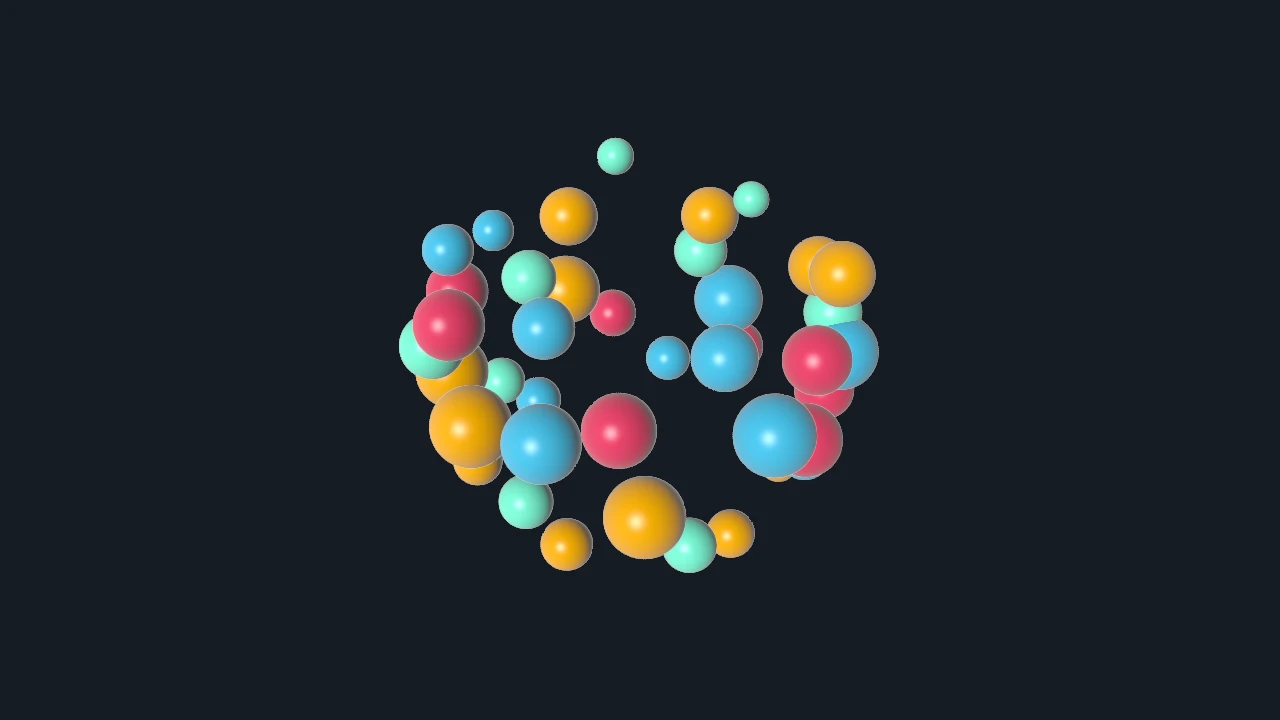
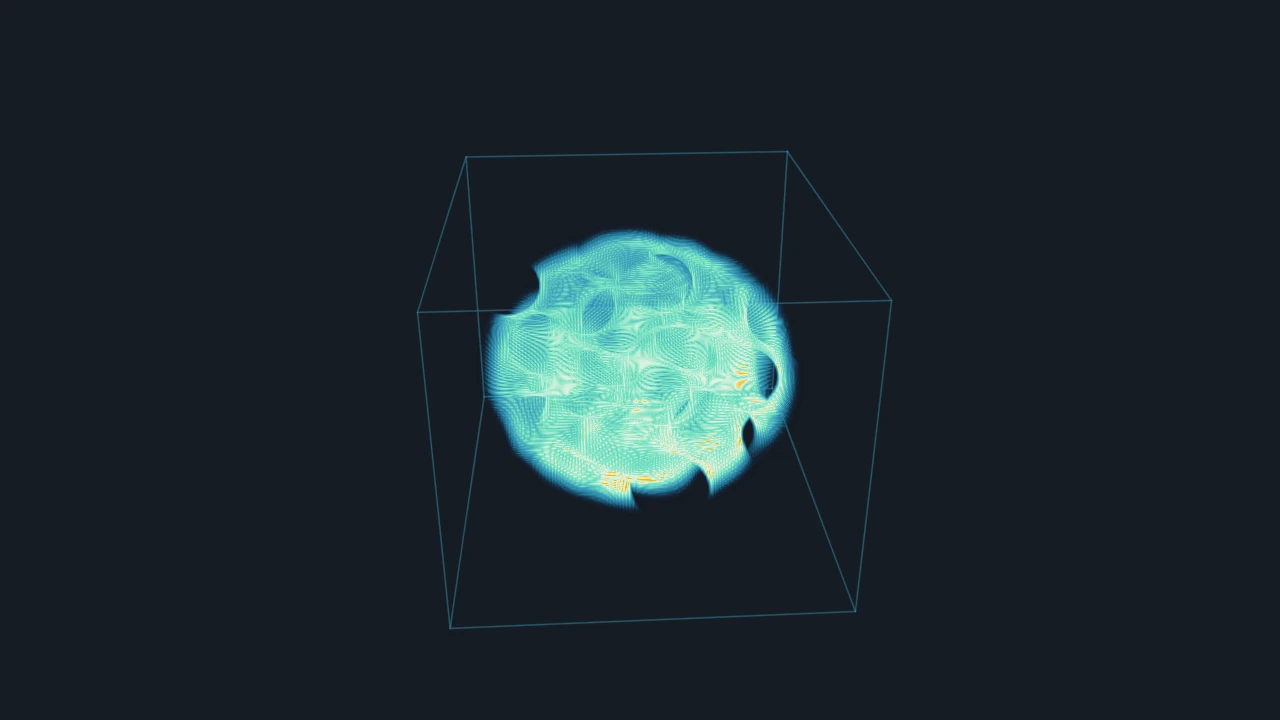
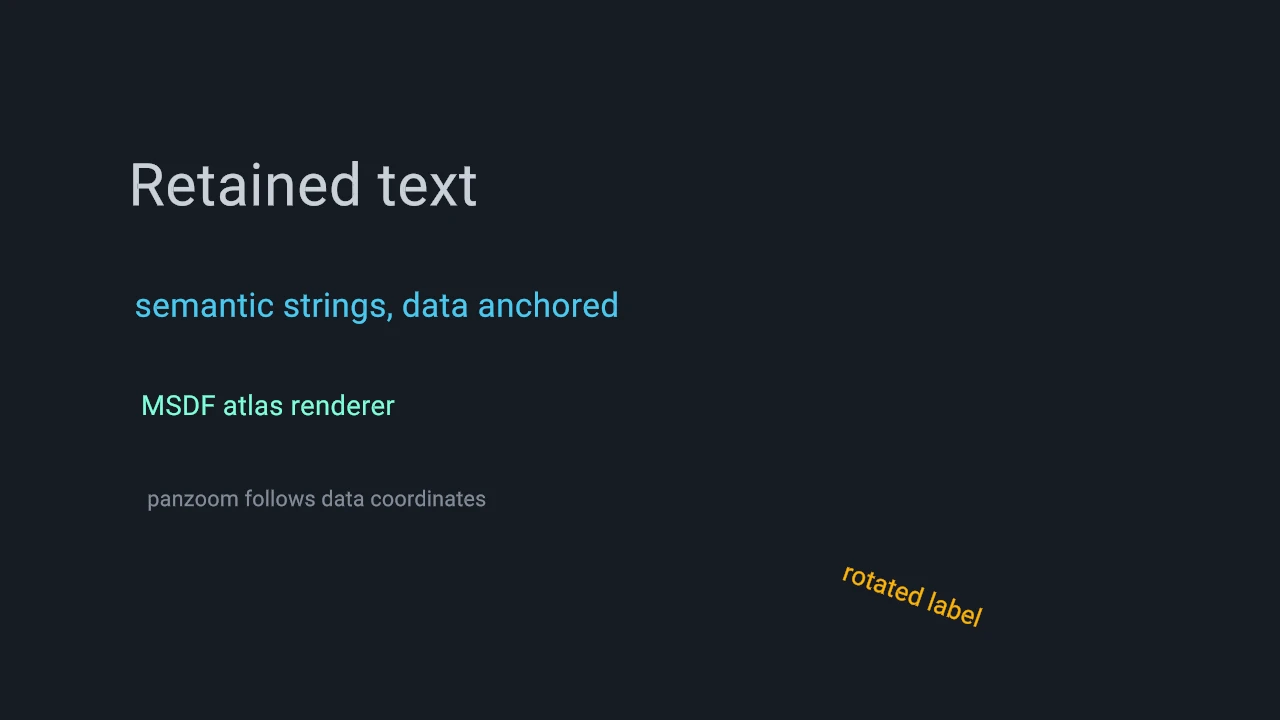
The examples below show the main data-shape choices. Each image links to the complete canonical example; use the decision matrix for neighboring or more specialized families.

Decision matrix
| Data shape | Usually use | Reference | Canonical gallery |
|---|---|---|---|
| Dense scatter samples or point clouds | Point | Point | Point |
| Point samples that need symbolic shapes | Marker | Marker | Marker |
| Screen-aligned sparse raster cells | Pixel | Pixel | Pixel |
| Experimental Gaussian footprints | Splat | Splat | Splat |
| Connected polylines, curves, or trajectories | Path | Path | Path |
| Independent line segments | Segment | Segment | Segment |
| Arrow or vector-field glyphs | Vector | Vector | Vector |
| Simple triangle or line batches | Primitive | Primitive | Primitive |
| 2D sampled scalar/color field | Image | Image | Image |
| Integer label field or segmentation mask | Labels | Labels | Labels |
| 3D sampled scalar field | Volume | Volume | Volume |
| Triangulated surface or textured object | Mesh | Mesh | Mesh |
| Many copies of the same 3D object | Mesh with instance_transform |
Mesh | Mesh Instance Selection |
| 3D balls, atoms, or particles with world-space radius | Sphere | Sphere | Sphere |
| Human-readable retained strings | Text | Text | Text |
| Low-level font-atlas quads | Glyph | Glyph | Glyph |
The constructor names in the table are available from both import datoviz as dvz and the C API.
The table selects a family only; its reference page remains authoritative for attribute names,
dtypes, shapes, and required resources.
Compare neighboring choices
Use dvz_point() for dense circular marks when shape does not carry meaning. Use dvz_marker()
when different symbols are part of the encoding. Use dvz_pixel() when every item should occupy a
screen-aligned square cell. Use dvz_sphere() when each item has a 3D world-space radius and should
participate in lighting/depth as a sphere. Use dvz_splat() only for the experimental Gaussian
footprint path.
Use dvz_path() when consecutive vertices form a connected curve. Use dvz_segment() when each
line is independent and has its own endpoints. Use dvz_vector() when the visual should encode a
direction or displacement with arrow-like glyphs.
Use dvz_image() for regular 2D sampled fields and textures. Use dvz_labels() for integer label
fields that need categorical colors, background IDs, hidden IDs, selection, or boundaries. Use
dvz_volume() when the field is truly 3D and should be sampled as a volume rather than sliced into
independent images.
Use dvz_primitive() for simple explicit triangle or line batches when you do not need mesh
materials, normals, texture coordinates, or instancing. Use dvz_mesh() for surfaces and objects
with real geometry contracts, especially when normals, materials, texture coordinates, or repeated
instances matter.
Use dvz_text() for semantic strings and annotation text. dvz_labels() is not a per-string label
API; it renders categorical sampled fields. Use dvz_glyph() only when you need low-level control
over atlas glyph quads.
Important details
Visual families are lower-level than plotting functions. A composed chart may use several visuals plus adornments. Keep those compositions in examples and use How-To pages for the reusable workflow.
Attributes are per-visual arrays. Put as many homogeneous items as possible into those arrays so a single visual can drive a large GPU batch.
For many similar 3D meshes, such as a field of cubes or repeated glyph-like solids, use one mesh
visual with shared geometry and upload one "instance_transform" matrix per copy. Do not create one
mesh visual per cube unless each cube needs a distinct material, lifetime, or update schedule.
Split data into multiple visuals only when the split changes one of these contracts:
- Visual family or topology.
- Panel or coordinate transform.
- Material, texture, lighting, depth, or blending policy.
- Update schedule or lifetime.
- Query/picking capability or selection policy.
If the difference is only per-item color, size, radius, symbol, category, or transform, prefer one visual with per-item attributes.
Common mistakes
- Using mesh for point clouds; use point, marker, sphere, or splat depending on visual weight.
- Using image for sparse cells; use pixel or primitive when every cell is independent geometry.
- Creating one visual per data item instead of one visual containing many items.
- Using labels for ordinary strings; use text or annotation labels instead.
- Using primitive when the data already has mesh semantics such as normals, UVs, materials, or repeated instances.
Next steps
- Add visuals to a panel
- Use sampled fields and textures
- Add text, labels, and annotations
- Visual families reference
Complete and related examples
- Canonical complete example: Point - Source:
examples/c/visuals/point.c - Additional source directory:
examples/c/visuals/ - Gallery index: Visual examples
- Manifest:
examples/c/MANIFEST.yaml