What is Datoviz?
Datoviz is a GPU visualization engine for rendering scientific data in images and interactive windows. It is useful when your data is large, changes over time, or needs more direct rendering control than a plotting function provides.
Examples include point clouds, images, meshes, volumes, text labels, several linked panels, and screenshots made without opening a window.
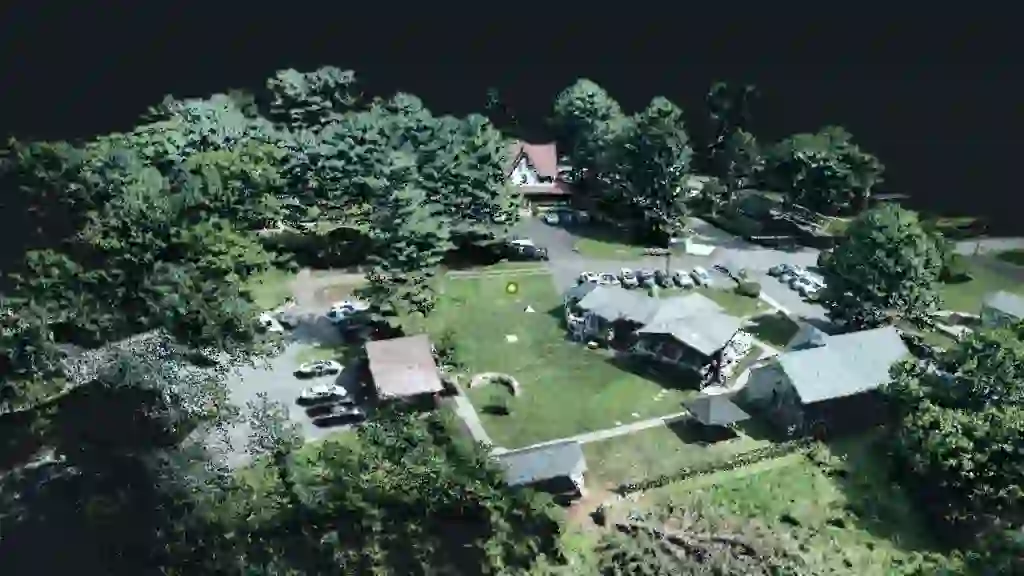
The main idea is simple:
- create a scene, figure, and panel;
- create one or more visuals, such as points, an image, or a mesh;
- upload data arrays to the visual's named attributes;
- attach each visual to a panel;
- open a window or render the figure offscreen.
What you build
Most Datoviz examples use the same pieces:
| Piece | What it means |
|---|---|
| Scene | The whole visualization. |
| Figure | The image area, with a pixel size such as 800 by 600. |
| Panel | A drawing area inside the figure. One figure can contain one panel or many panels. |
| Visual | A renderable collection, such as points, line segments, an image, a mesh, or text. |
| Data arrays | NumPy arrays or C arrays attached to visual attributes such as position, color, or size. |
| Controller | Optional navigation state, such as 2D panzoom or a 3D arcball. |
| View | A native window, offscreen target, or supported embedded host where the figure is rendered. |
This structure is more explicit than scatter() or imshow(), but it gives you direct control over
what is drawn and what changes from one frame to the next.
When Datoviz fits
Use Datoviz directly when you want to:
- display many points, images, meshes, volumes, or labels interactively;
- update visual data over time without rebuilding the whole scene;
- render native desktop windows or offscreen screenshots;
- embed Datoviz in a C/C++ application;
- write Python examples that pass NumPy arrays to the current v0.4 API.
Datoviz is a good fit when render control, data volume, interaction, or embedding matters. For a small conventional chart where a high-level plotting library already provides the complete result, that library may be the shorter path.
Datoviz v0.4 is not a high-level plotting library. Higher-level plotting belongs to GSP/VisPy2, which is still work in progress. Use Datoviz directly when you want the explicit scene model shown above.
Python and C
You can use Datoviz from C, C++, or Python.
In Python, start with:
import datoviz as dvz
This package uses the same dvz_* function names as the C examples and supports documented NumPy
array uploads. The dvz.run(...) helper manages the ordinary Python window session. Use
datoviz.raw only when you need exact pointer-and-count calls or ABI-level control.
Where to start
For the shortest first run, use the Python-first Quickstart. For a native C program, use First C Program. Use Choose your layer when deciding between Python, C, browser examples, or advanced integration paths. Read Core concepts for the exact shared object model.