Quickstart: Rendering in 10 minutes
Prerequisite: Datoviz v0.4 installed from source or from PyPI with python -m pip install --pre datoviz==0.4.0rc2. Check Install for platform details.
This page builds one complete visualization: 10,000 random points in an interactive window. You can drag to pan and scroll to zoom. No data files are needed.
Read the example in five blocks: create the data arrays, create the scene layout, upload the arrays to one point visual, bind panzoom interaction, then open the window.
The displayed programs use the same visual contract as the examples/c/start/scatter.c gallery
scenario: a 1280 by 720 canvas, seeded random positions and colors, translucent 4–12 px points,
and XY panzoom. Each language uses its standard local PRNG, so individual point coordinates differ
while the documented result remains the same.
Complete runnable programs
Both tabs contain complete programs, including imports or headers, data generation, rendering, and
the appropriate session or cleanup path. The source is included from checked files in
examples/docs/.
import numpy as np
import datoviz as dvz


# Create deterministic NumPy arrays for one point per row.
n = 10_000
rng = np.random.default_rng(12345)
positions = rng.uniform(-1, 1, (n, 3)).astype(np.float32)
positions[:, 2] = 0
colors = rng.integers(0, 256, (n, 4), dtype=np.uint8)
colors[:, 3] = 200
diameters = rng.uniform(4, 12, n).astype(np.float32)

# Create the retained scene, its output figure, and one full-size panel.
scene = dvz.dvz_scene()
figure = dvz.dvz_figure(scene, 1280, 720, 0)
panel = dvz.dvz_panel_full(figure)

# Attach the arrays to a point visual, then add it to the panel.
points = dvz.dvz_point(scene, 0)
dvz.dvz_visual_set_data_many(
    points,
    {"position": positions, "color": colors, "diameter_px": diameters},
)
dvz.dvz_panel_add_visual(panel, points, None)

# Bind 2D pan and zoom interaction, then open the native window.
panzoom = dvz.dvz_panzoom(scene, None)
dvz.dvz_panel_bind_controller(panel, panzoom, dvz.DVZ_DIM_MASK_XY)

dvz.run(scene, figure, title="Datoviz Quickstart")
#include <stdbool.h>
#include <stdint.h>
#include <stdio.h>
#include <stdlib.h>
#include <string.h>

#include "datoviz/app.h"
#include "datoviz/scene.h"

#define WIDTH  1280u
#define HEIGHT 720u
#define N      10000u

static uint32_t _random_state = 12345u;

static uint32_t _random_u32(void)
{
    uint32_t x = _random_state;
    x ^= x << 13;
    x ^= x >> 17;
    x ^= x << 5;
    return _random_state = x;
}

static float _random_f32(float min, float max)
{
    return min + (max - min) * ((float)_random_u32() / (float)UINT32_MAX);
}

int main(int argc, char** argv)
{
    int rc = EXIT_FAILURE;
    DvzScene* scene = NULL;
    DvzApp* app = NULL;
    float* positions = calloc(N * 3u, sizeof(*positions));
    uint8_t* colors = calloc(N * 4u, sizeof(*colors));
    float* diameters = calloc(N, sizeof(*diameters));
    if (positions == NULL || colors == NULL || diameters == NULL)
    {
        fprintf(stderr, "quickstart: data allocation failed\n");
        goto cleanup;
    }

    for (uint32_t i = 0; i < N; i++)
    {
        positions[3 * i + 0] = _random_f32(-1.0f, +1.0f);
        positions[3 * i + 1] = _random_f32(-1.0f, +1.0f);
        colors[4 * i + 0] = (uint8_t)_random_u32();
        colors[4 * i + 1] = (uint8_t)_random_u32();
        colors[4 * i + 2] = (uint8_t)_random_u32();
        colors[4 * i + 3] = 200;
        diameters[i] = _random_f32(4.0f, 12.0f);
    }

    scene = dvz_scene();
    DvzFigure* figure = scene != NULL ? dvz_figure(scene, WIDTH, HEIGHT, 0) : NULL;
    DvzPanel* panel = figure != NULL ? dvz_panel_full(figure) : NULL;
    if (scene == NULL || figure == NULL || panel == NULL)
    {
        fprintf(stderr, "quickstart: scene, figure, or panel creation failed\n");
        goto cleanup;
    }

    DvzColor background = {13, 18, 25, 255};
    if (dvz_panel_set_background_color(panel, background) != 0)
        goto api_error;
    DvzController* controller = dvz_panzoom(scene, NULL);
    if (controller == NULL || dvz_panel_bind_controller(panel, controller, DVZ_DIM_MASK_XY) != 0)
        goto api_error;

    DvzVisual* points = dvz_point(scene, 0);
    if (points == NULL)
        goto api_error;
    DvzVisualDataUpdate updates[] = {
        {.attr_name = "position", .data = positions, .item_count = N},
        {.attr_name = "color", .data = colors, .item_count = N},
        {.attr_name = "diameter_px", .data = diameters, .item_count = N},
    };
    if (dvz_visual_set_data_many(points, updates, 3) != 0)
        goto api_error;
    DvzPointStyleDesc style = dvz_point_style_desc();
    style.aspect = DVZ_SHAPE_ASPECT_FILLED;
    style.stroke_width_px = 0.0f;
    if (dvz_point_set_style(points, &style) != 0 ||
        dvz_visual_set_depth_test(points, false) != 0 ||
        dvz_visual_set_alpha_mode(points, DVZ_ALPHA_BLENDED) != 0 ||
        dvz_panel_add_visual(panel, points, NULL) != 0)
        goto api_error;

    app = dvz_app(scene);
    DvzView* view =
        app != NULL ? dvz_view_window(app, figure, WIDTH, HEIGHT, "Datoviz Quickstart") : NULL;
    if (app == NULL || view == NULL)
        goto api_error;
    uint32_t frame_count =
        argc == 3 && strcmp(argv[1], "--frames") == 0 ? (uint32_t)strtoul(argv[2], NULL, 10) : 0;
    dvz_app_run(app, frame_count);
    rc = EXIT_SUCCESS;
    goto cleanup;

api_error:
    fprintf(stderr, "quickstart: Datoviz setup failed\n");

cleanup:
    if (app != NULL)
        dvz_app_destroy(app);
    if (scene != NULL)
        dvz_scene_destroy(scene);
    free(diameters);
    free(colors);
    free(positions);
    return rc;
}
Build and run
From a source checkout, run the displayed program:
python examples/docs/quickstart.py
From another directory, save the Python tab as quickstart.py and run it in the environment
where Datoviz and NumPy are installed:
python quickstart.py
From a source checkout, compile and run the displayed program:
just quickstart-c
./build/examples/docs/quickstart
For a standalone C file outside the repository, use an installed Datoviz package and its
exported CMake package or datoviz-config helper. See Use from C or C++.
What you should see
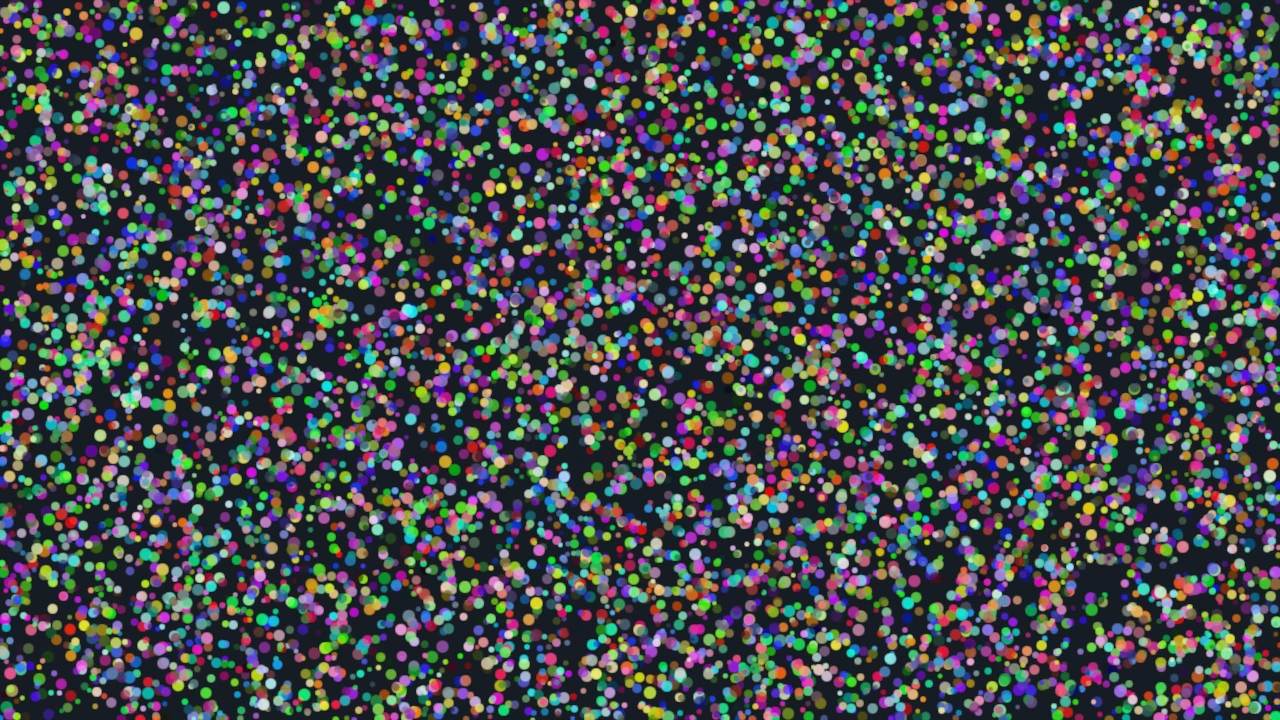
A dark window containing 10,000 colored dots. Drag to pan, scroll to zoom.
How it works
Data arrays - The example creates three arrays with the same length. position stores x,
y, and z coordinates for each point. color stores red, green, blue, and alpha values.
diameter_px stores the point size in screen pixels. In Python, these are NumPy arrays. In C, they
are ordinary C arrays.
Scene, figure, panel - A scene is the whole visualization. A figure is the image area, here
1280 by 720 pixels. A panel is the part of the figure where the scatter plot is drawn. This
quickstart uses one full-size panel.
Controller - dvz_panzoom adds mouse interaction. dvz_panel_bind_controller connects it to
the panel and limits the interaction to the X and Y axes.
Visual - A visual is a renderable collection, such as points, lines, an image, a mesh, or text
labels. Here, dvz_point creates one point visual for all 10,000 points. Each
dvz_visual_set_data call fills one named attribute of that visual: "position", "color", or
"diameter_px".
Panel attachment - Data upload prepares the visual, but it does not place it in the figure.
dvz_panel_add_visual attaches the visual to the panel so it will be drawn.
Run and cleanup - In Python, dvz.run(scene, figure) opens the window and blocks while it is
open; the helper manages the ordinary app session. In C, the program explicitly creates the app and
window view, runs the app, then destroys the app before the scene. Close the window to end either
interactive run.
Change the example safely
Keep the three point-attribute arrays aligned: row i of position, color, and diameter_px
describes the same point. If you change n, regenerate all three arrays with that length. Positions
are float32 with shape (n, 3), colors are uint8 RGBA with shape (n, 4), and diameters are
float32 with shape (n,).
To adapt this example to your data, replace only the data-generation block first. Once that works, use Choose a visual family if points are not the right representation, or Update visual data for changing arrays after the first frame.
Next steps
- Browse the Examples gallery for visual families, features, and showcase scenes.
- C and C++ users can continue with First C Program for the call order and installed-project path.
- Read Core concepts for the reusable object and data model.
- To render without a window, see Render offscreen.
- To add 3D rotation instead of panzoom, see Use 3D controllers.