Scientific Plotting Workflow
This example composes common scientific plot elements in one figure.
Preview
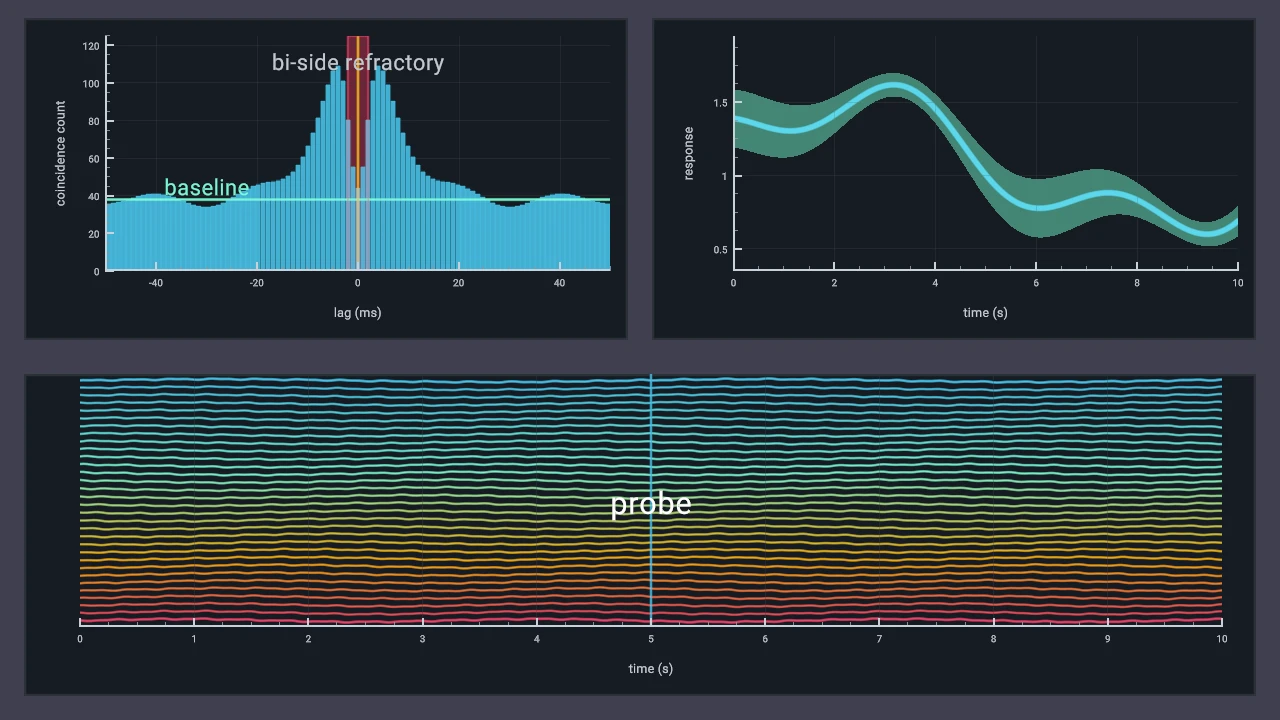
Run And Adapt
Commands below assume a Datoviz source checkout and start at the repository root. Use your configured build environment; Python routes additionally require local bindings.
| Route | Availability | Command or action |
|---|---|---|
| C | Canonical native source | just example-c showcases/scientific_plotting (build and run), or rerun ./build/examples/c/showcases/scientific_plotting |
| Python | Available | python3 -m examples.python.gallery.showcases.scientific_plotting |
| Browser | Live WebGPU route | Open live example |
Use this example as capability or integration evidence, not as a minimal copy-paste template. Start from the nearest supported, copy-safe example and add this feature after verifying the linked API reference.
What To Look For
The layout combines an autocorrelogram-style histogram, guide spans, a mean trace with an uncertainty band, and 32 stacked traces generated from deterministic arrays. In the screenshot, compare how axes, text labels, bands, paths, primitives, and segments work together without each panel becoming a separate application.
This workflow is useful when a paper-style diagnostic figure needs multiple coordinated visual encodings but the data can still be prepared as simple numeric arrays.
Source
#!/usr/bin/env python3
"""Scientific plotting workflow with panels, guides, bars, bands, and traces."""

from __future__ import annotations

import ctypes

import numpy as np

import datoviz as dvz

from examples.python.gallery import common as ex


CORR_BINS = 101
MEAN_COUNT = 320
TRACE_COUNT = 32
TRACE_SAMPLES = 320
TRACE_VERTEX_COUNT = TRACE_COUNT * TRACE_SAMPLES
TAU = 2.0 * np.pi


def _lerp_color(a, b, t: float, alpha: int):
    return (
        int((1.0 - t) * a.r + t * b.r),
        int((1.0 - t) * a.g + t * b.g),
        int((1.0 - t) * a.b + t * b.b),
        alpha,
    )


def _trace_color(channel: int):
    u = channel / float(TRACE_COUNT - 1) if TRACE_COUNT > 1 else 0.0
    cyan = dvz.DvzColor(76, 201, 240, 255)
    mint = dvz.DvzColor(128, 255, 219, 255)
    amber = dvz.DvzColor(255, 183, 3, 255)
    rose = dvz.DvzColor(239, 71, 111, 255)
    if u < 0.38:
        return _lerp_color(cyan, mint, u / 0.38, 235)
    if u < 0.74:
        return _lerp_color(mint, amber, (u - 0.38) / 0.36, 235)
    return _lerp_color(amber, rose, (u - 0.74) / 0.26, 235)


def _autocorr_value(lag_ms):
    baseline = 38.0
    peak = 88.0 * np.exp(-(lag_ms * lag_ms) / (2.0 * 7.4 * 7.4))
    theta = 10.0 * np.cos(0.31 * lag_ms) * np.exp(-np.abs(lag_ms) / 34.0)
    refractory = 92.0 * np.exp(-(lag_ms * lag_ms) / (2.0 * 1.8 * 1.8))
    return np.maximum(baseline + peak + theta - refractory, 1.0)


def _autocorrelogram_data():
    starts = np.linspace(-50.0, 50.0, CORR_BINS, endpoint=False, dtype=np.float64)
    ends = starts + 100.0 / float(CORR_BINS)
    values = _autocorr_value(0.5 * (starts + ends)).astype(np.float64)
    return starts, ends, values


def _mean_error_data():
    t = np.linspace(0.0, 1.0, MEAN_COUNT, dtype=np.float64)
    y = 1.1 + 0.42 * np.sin(TAU * (0.82 * t + 0.08))
    y += 0.18 * np.sin(TAU * (2.4 * t + 0.42))
    e = 0.14 + 0.06 * np.sin(TAU * (1.7 * t + 0.20))
    x = 10.0 * t
    return x, y - e, y + e, y


def _stacked_trace_data():
    positions = np.zeros((TRACE_VERTEX_COUNT, 3), dtype=np.float32)
    colors = np.zeros((TRACE_VERTEX_COUNT, 4), dtype=np.uint8)
    widths = np.zeros(TRACE_VERTEX_COUNT, dtype=np.float32)
    subpaths = np.full(TRACE_COUNT, TRACE_SAMPLES, dtype=np.uint32)
    t = np.linspace(0.0, 1.0, TRACE_SAMPLES, dtype=np.float32)

    for ch in range(TRACE_COUNT):
        row = float(TRACE_COUNT - 1 - ch)
        phase = ch / float(TRACE_COUNT)
        y = row + 0.19 * np.sin(TAU * ((2.1 + 0.035 * ch) * t + phase))
        y += 0.055 * np.sin(TAU * (27.0 * t + 0.11 * ch))
        y += 0.035 * np.cos(TAU * (53.0 * t + 0.07 * ch))
        k0 = ch * TRACE_SAMPLES
        k1 = k0 + TRACE_SAMPLES
        positions[k0:k1, 0] = 10.0 * t
        positions[k0:k1, 1] = y
        colors[k0:k1] = _trace_color(ch)
        widths[k0:k1] = 1.9 if ch in (0, TRACE_COUNT - 1) else 1.55

    return positions, colors, widths, subpaths


def _set_domain(panel, x0: float, x1: float, y0: float, y1: float) -> None:
    if dvz.dvz_panel_set_domain(panel, dvz.DVZ_DIM_X, x0, x1) != 0:
        raise RuntimeError("dvz_panel_set_domain(X) failed")
    if dvz.dvz_panel_set_domain(panel, dvz.DVZ_DIM_Y, y0, y1) != 0:
        raise RuntimeError("dvz_panel_set_domain(Y) failed")


def _configure_panel(panel) -> None:
    dvz.dvz_panel_set_background_color(panel, ex.BG)
    border = dvz.dvz_panel_border_desc()
    border.visible = True
    border.color = dvz.DvzColor(ex.BLUE.r, ex.BLUE.g, ex.BLUE.b, 220)
    border.width_px = 2.0
    border.inset_px = 1.0
    if dvz.dvz_panel_set_border(panel, ctypes.byref(border)) != 0:
        raise RuntimeError("dvz_panel_set_border() failed")


def _add_axes(
    panel,
    x_label: bytes | None,
    y_label: bytes | None,
    *,
    show_y_axis: bool = True,
) -> None:
    x_axis = dvz.dvz_panel_axis(panel, dvz.DVZ_DIM_X)
    y_axis = dvz.dvz_panel_axis(panel, dvz.DVZ_DIM_Y)
    if not x_axis or not y_axis:
        raise RuntimeError("dvz_panel_axis() failed")

    ticks = dvz.dvz_axis_tick_policy()
    ticks.target_count = 6
    ticks.min_pixel_spacing = 92.0
    ticks.minor_per_interval = 3
    for axis in (x_axis, y_axis):
        if dvz.dvz_axis_set_tick_policy(axis, ctypes.byref(ticks)) != 0:
            raise RuntimeError("dvz_axis_set_tick_policy() failed")

    for axis, vertical in ((x_axis, False), (y_axis, True)):
        style = dvz.dvz_axis_style()
        style.tick_size_px = 10.0
        style.label_size_px = 13.0
        style.tick_gap_px = 6.0
        style.label_gap_px = 18.0 if vertical else 0.0
        style.grid_color[:] = (96, 165, 250, 105)
        style.spine_color[:] = (217, 226, 236, 210)
        style.major_tick_color[:] = (217, 226, 236, 230)
        style.minor_tick_color[:] = (217, 226, 236, 190)
        if dvz.dvz_axis_set_style(axis, ctypes.byref(style)) != 0:
            raise RuntimeError("dvz_axis_set_style() failed")

    if dvz.dvz_axis_set_grid(x_axis, True) != 0:
        raise RuntimeError("dvz_axis_set_grid(X) failed")
    if dvz.dvz_axis_set_grid(y_axis, show_y_axis) != 0:
        raise RuntimeError("dvz_axis_set_grid(Y) failed")
    if dvz.dvz_axis_set_visible(y_axis, show_y_axis) != 0:
        raise RuntimeError("dvz_axis_set_visible(Y) failed")
    if x_label is not None and dvz.dvz_axis_set_label(x_axis, x_label) != 0:
        raise RuntimeError("dvz_axis_set_label(X) failed")
    if show_y_axis and y_label is not None and dvz.dvz_axis_set_label(y_axis, y_label) != 0:
        raise RuntimeError("dvz_axis_set_label(Y) failed")


def _add_label(panel, text: bytes, position, offset, color) -> None:
    style = dvz.dvz_text_style()
    style.size_px = 14.0
    style.renderer = dvz.DVZ_TEXT_RENDERER_MSDF_ATLAS
    style.color[:] = color

    placement = dvz.dvz_text_placement()
    placement.mode = dvz.DVZ_TEXT_PLACEMENT_DATA
    placement.position[:] = position
    placement.offset[:] = offset
    placement.text_anchor[:] = (0.5, 0.5)
    placement.has_text_anchor = True
    placement.depth_test = False

    desc = dvz.dvz_label_desc()
    desc.text = text
    annotation = dvz.dvz_annotation_label(panel, ctypes.byref(desc))
    if not annotation:
        raise RuntimeError("dvz_annotation_label() failed")
    if dvz.dvz_annotation_set_style(annotation, ctypes.byref(style)) != 0:
        raise RuntimeError("dvz_annotation_set_style() failed")
    if dvz.dvz_annotation_set_placement(annotation, ctypes.byref(placement)) != 0:
        raise RuntimeError("dvz_annotation_set_placement() failed")


def _add_autocorrelogram(panel) -> None:
    starts, ends, values = _autocorrelogram_data()

    bars_desc = dvz.dvz_bars_desc()
    bars_desc.fill_color = dvz.DvzColor(76, 201, 240, 185)
    bars_desc.outline_color = dvz.DvzColor(76, 201, 240, 75)
    bars_desc.outline_width_px = 0.8
    bars_desc.gap_fraction = 0.08
    bars = dvz.dvz_bars(panel, ctypes.byref(bars_desc))
    if not bars:
        raise RuntimeError("dvz_bars() failed")
    if dvz.dvz_bars_set_intervals(bars, starts, ends, values) != 0:
        raise RuntimeError("dvz_bars_set_intervals() failed")

    span_desc = dvz.dvz_guide_span_desc()
    span_desc.orientation = dvz.DVZ_GUIDE_ORIENTATION_VERTICAL
    span_desc.min_value = -2.0
    span_desc.max_value = 2.0
    span_desc.fill_color = dvz.DvzColor(239, 71, 111, 42)
    span_desc.outline_color = dvz.DvzColor(239, 71, 111, 165)
    span_desc.outline_width_px = 1.5
    if not dvz.dvz_guide_span(panel, ctypes.byref(span_desc)):
        raise RuntimeError("dvz_guide_span() failed")

    baseline = dvz.dvz_guide_line_desc()
    baseline.orientation = dvz.DVZ_GUIDE_ORIENTATION_HORIZONTAL
    baseline.value = 38.0
    baseline.color = dvz.DvzColor(128, 255, 219, 220)
    baseline.stroke_width_px = 2.25
    if not dvz.dvz_guide_line(panel, ctypes.byref(baseline)):
        raise RuntimeError("dvz_guide_line(baseline) failed")

    zero = dvz.dvz_guide_line_desc()
    zero.orientation = dvz.DVZ_GUIDE_ORIENTATION_VERTICAL
    zero.value = 0.0
    zero.color = dvz.DvzColor(255, 183, 3, 220)
    zero.stroke_width_px = 2.0
    if not dvz.dvz_guide_line(panel, ctypes.byref(zero)):
        raise RuntimeError("dvz_guide_line(zero) failed")

    _add_label(
        panel,
        b"bi-side refractory",
        (0.0, 112.0, 0.0),
        (0.0, 0.0),
        (217, 226, 236, 235),
    )
    _add_label(panel, b"baseline", (-30.0, 38.0, 0.0), (0.0, -14.0), (128, 255, 219, 235))


def _add_mean_error(panel) -> None:
    x, lower, upper, center = _mean_error_data()

    desc = dvz.dvz_band_desc()
    desc.fill_color = dvz.DvzColor(128, 255, 219, 58)
    desc.line_color = dvz.DvzColor(76, 201, 240, 255)
    desc.line_width_px = 5.5
    band = dvz.dvz_band(panel, ctypes.byref(desc))
    if not band:
        raise RuntimeError("dvz_band() failed")
    if dvz.dvz_band_set_bounds(band, x, lower, upper) != 0:
        raise RuntimeError("dvz_band_set_bounds() failed")
    if dvz.dvz_band_set_center(band, x, center) != 0:
        raise RuntimeError("dvz_band_set_center() failed")


def _add_stacked_traces(scene, panel) -> None:
    cursor = dvz.dvz_guide_line_desc()
    cursor.orientation = dvz.DVZ_GUIDE_ORIENTATION_VERTICAL
    cursor.value = 5.0
    cursor.color = dvz.DvzColor(76, 201, 240, 200)
    cursor.stroke_width_px = 1.75
    cursor.label = b"probe"
    if not dvz.dvz_guide_line(panel, ctypes.byref(cursor)):
        raise RuntimeError("dvz_guide_line(cursor) failed")

    positions, colors, widths, subpaths = _stacked_trace_data()
    traces = dvz.dvz_path(scene, 0)
    if not traces:
        raise RuntimeError("dvz_path() failed")
    if dvz.dvz_visual_set_data_many(
        traces,
        {
            "position": positions,
            "color": colors,
            "stroke_width_px": widths,
        },
    ) != 0:
        raise RuntimeError("dvz_visual_set_data_many(traces) failed")
    lengths = np.ctypeslib.as_ctypes(subpaths)
    if dvz.dvz_path_set_subpaths(traces, TRACE_COUNT, lengths) != 0:
        raise RuntimeError("dvz_path_set_subpaths() failed")
    if dvz.dvz_path_set_caps(traces, dvz.DVZ_SEGMENT_CAP_ROUND, dvz.DVZ_SEGMENT_CAP_ROUND) != 0:
        raise RuntimeError("dvz_path_set_caps() failed")
    if dvz.dvz_path_set_join(traces, dvz.DVZ_PATH_JOIN_ROUND, 4.0) != 0:
        raise RuntimeError("dvz_path_set_join() failed")
    if dvz.dvz_visual_set_depth_test(traces, False) != 0:
        raise RuntimeError("dvz_visual_set_depth_test(traces) failed")
    ex.add_visual(panel, traces)


def _build_scene():
    scene = dvz.dvz_scene()
    if not scene:
        raise RuntimeError("dvz_scene() failed")
    figure = dvz.dvz_figure(scene, ex.WIDTH, ex.HEIGHT, 0)
    if not figure:
        raise RuntimeError("dvz_figure() failed")
    grid = dvz.dvz_figure_grid(figure, 2, 2)
    if not grid:
        raise RuntimeError("dvz_figure_grid() failed")

    margins = dvz.DvzPanelReserve(24.0, 24.0, 18.0, 24.0)
    if dvz.dvz_grid_set_margins(grid, ctypes.byref(margins)) != 0:
        raise RuntimeError("dvz_grid_set_margins() failed")
    if dvz.dvz_grid_set_gutter(grid, 24.0, 34.0) != 0:
        raise RuntimeError("dvz_grid_set_gutter() failed")

    correlogram = dvz.dvz_grid_panel(grid, 0, 0)
    mean_error = dvz.dvz_grid_panel(grid, 0, 1)
    stacked = dvz.dvz_grid_panel_span(grid, 1, 0, 1, 2)
    if not correlogram or not mean_error or not stacked:
        raise RuntimeError("dvz_grid_panel() failed")

    for panel in (correlogram, mean_error, stacked):
        _configure_panel(panel)

    _set_domain(correlogram, -50.0, 50.0, 0.0, 125.0)
    _set_domain(mean_error, 0.0, 10.0, 0.35, 1.95)
    _set_domain(stacked, 0.0, 10.0, -0.85, 31.85)

    reserve = dvz.DvzPanelReserve(56.0, 16.0, 0.0, 0.0)
    if dvz.dvz_panel_set_reserve(stacked, ctypes.byref(reserve)) != 0:
        raise RuntimeError("dvz_panel_set_reserve() failed")

    _add_autocorrelogram(correlogram)
    _add_mean_error(mean_error)
    _add_stacked_traces(scene, stacked)

    _add_axes(correlogram, b"lag (ms)", b"coincidence count")
    _add_axes(mean_error, b"time (s)", b"response")
    _add_axes(stacked, b"time (s)", None, show_y_axis=False)
    return scene, figure, (correlogram, mean_error, stacked)


def _configure_view(view, scene, panels) -> None:
    correlogram, mean_error, stacked = panels
    ex.bind_panzoom(view, scene, correlogram, dvz.DVZ_DIM_MASK_XY)
    ex.bind_panzoom(view, scene, mean_error, dvz.DVZ_DIM_MASK_XY)
    ex.bind_panzoom(view, scene, stacked, dvz.DVZ_DIM_MASK_X)


def main() -> None:
    scene, figure, panels = _build_scene()

    def configure(view) -> None:
        _configure_view(view, scene, panels)

    ex.run_with_view(scene, figure, "Scientific Plotting Workflow", configure)


if __name__ == "__main__":
    main()
/*
 * Copyright (c) 2021 Cyrille Rossant and contributors. All rights reserved.
 * Licensed under the MIT license. See LICENSE file in the project root for details.
 * SPDX-License-Identifier: MIT
 */

/* scientific_plotting - This example composes common scientific plot elements in one figure.
 *
 * What to look for: the layout combines an autocorrelogram-style histogram, guide spans, a mean
 * trace with an uncertainty band, and 32 stacked traces generated from deterministic arrays. In the
 * screenshot, compare how axes, text labels, bands, paths, primitives, and segments work together
 * without each panel becoming a separate application.
 *
 * This workflow is useful when a paper-style diagnostic figure needs multiple coordinated visual
 * encodings but the data can still be prepared as simple numeric arrays.
 *
 * Scenario: showcases_scientific_plotting
 * Style: showcase workflow, graphite_cyan, 1280x720 window target
 *
 * Build:  just example-c showcases/scientific_plotting
 * Run:    ./build/examples/c/showcases/scientific_plotting --live
 * Smoke:  ./build/examples/c/showcases/scientific_plotting --png
 */


/*************************************************************************************************/
/*  Includes                                                                                     */
/*************************************************************************************************/

#include <math.h>
#include <stdbool.h>
#include <stdint.h>

#include "_assertions.h"
#include "datoviz/scene.h"
#include "example_common.h"
#include "example_style.h"
#include "runner/scenario_runner.h"


DvzScenarioSpec dvz_showcase_scientific_plotting_scenario(void);


/*************************************************************************************************/
/*  Constants                                                                                    */
/*************************************************************************************************/

#define WIDTH  EXAMPLE_WINDOW_WIDTH
#define HEIGHT EXAMPLE_WINDOW_HEIGHT
#define CORR_BINS              101u
#define MEAN_COUNT             320u
#define TRACE_COUNT            32u
#define TRACE_SAMPLES          320u
#define TRACE_VERTEX_COUNT     (TRACE_COUNT * TRACE_SAMPLES)

static const float TAU = 6.28318530718f;


/*************************************************************************************************/
/*  Helpers                                                                                      */
/*************************************************************************************************/

/**
 * Linearly blend two 8-bit channels.
 *
 * @param a first channel
 * @param b second channel
 * @param t blend factor in [0, 1]
 * @return blended channel
 */
static uint8_t _lerp_u8(uint8_t a, uint8_t b, float t)
{
    return (uint8_t)((1.0f - t) * (float)a + t * (float)b);
}


/**
 * Blend two palette colors.
 *
 * @param a first color
 * @param b second color
 * @param t blend factor in [0, 1]
 * @param alpha output alpha
 * @return blended RGBA color
 */
static DvzColor _lerp_color(DvzColor a, DvzColor b, float t, uint8_t alpha)
{
    return dvz_color_rgba(_lerp_u8(a.r, b.r, t), _lerp_u8(a.g, b.g, t), _lerp_u8(a.b, b.b, t),
                          alpha);
}


/**
 * Return the stacked-trace color for one channel.
 *
 * @param channel channel index
 * @return trace color
 */
static DvzColor _trace_color(uint32_t channel)
{
    const float u = TRACE_COUNT > 1 ? (float)channel / (float)(TRACE_COUNT - 1u) : 0.0f;
    DvzColor cyan = example_graphite_cyan_color(EXAMPLE_STYLE_COLOR_ACCENT_PRIMARY);
    DvzColor mint = example_graphite_cyan_color(EXAMPLE_STYLE_COLOR_ACCENT_SECONDARY);
    DvzColor amber = example_graphite_cyan_color(EXAMPLE_STYLE_COLOR_WARNING);
    DvzColor rose = example_graphite_cyan_color(EXAMPLE_STYLE_COLOR_ERROR);
    if (u < 0.38f)
        return _lerp_color(cyan, mint, u / 0.38f, 235);
    if (u < 0.74f)
        return _lerp_color(mint, amber, (u - 0.38f) / 0.36f, 235);
    return _lerp_color(amber, rose, (u - 0.74f) / 0.26f, 235);
}


/**
 * Return a deterministic autocorrelogram value.
 *
 * @param lag_ms lag in milliseconds
 * @return count estimate
 */
static double _autocorr_value(double lag_ms)
{
    const double baseline = 38.0;
    const double peak = 88.0 * exp(-(lag_ms * lag_ms) / (2.0 * 7.4 * 7.4));
    const double theta = 10.0 * cos(0.31 * lag_ms) * exp(-fabs(lag_ms) / 34.0);
    const double refractory = 92.0 * exp(-(lag_ms * lag_ms) / (2.0 * 1.8 * 1.8));
    double value = baseline + peak + theta - refractory;
    return value < 1.0 ? 1.0 : value;
}


/**
 * Fill explicit interval bars for the spike-train autocorrelogram.
 *
 * @param starts output bin starts
 * @param ends output bin ends
 * @param values output bin values
 */
static void _fill_autocorrelogram(double starts[CORR_BINS], double ends[CORR_BINS],
                                  double values[CORR_BINS])
{
    const double min_lag = -50.0;
    const double bin_width = 100.0 / (double)CORR_BINS;
    for (uint32_t i = 0; i < CORR_BINS; i++)
    {
        starts[i] = min_lag + (double)i * bin_width;
        ends[i] = starts[i] + bin_width;
        values[i] = _autocorr_value(0.5 * (starts[i] + ends[i]));
    }
}


/**
 * Add a visual to a panel in data coordinates.
 *
 * @param panel target panel
 * @param visual visual
 * @param z_layer draw layer
 * @return true when the visual was attached
 */
static bool _add_data_visual(DvzPanel* panel, DvzVisual* visual, int32_t z_layer)
{
    DvzVisualAttachDesc attach = dvz_visual_attach_desc();
    attach.coord_space = DVZ_VISUAL_COORD_DATA;
    attach.z_layer = z_layer;
    return dvz_panel_add_visual(panel, visual, &attach) == 0;
}


/**
 * Add retained axes with compact showcase styling.
 *
 * @param panel target panel
 * @param x_label optional X label
 * @param y_label optional Y label
 * @param show_y_axis whether to show the Y axis
 * @param x_label_gap_px X axis title gap in pixels
 * @return true when the axes were configured
 */
static bool _add_axes(
    DvzPanel* panel, const char* x_label, const char* y_label, bool show_y_axis,
    float x_label_gap_px)
{
    DvzAxis* x_axis = dvz_panel_axis(panel, DVZ_DIM_X);
    DvzAxis* y_axis = dvz_panel_axis(panel, DVZ_DIM_Y);
    if (x_axis == NULL || y_axis == NULL)
        return false;

    DvzAxisTickPolicy ticks = dvz_axis_tick_policy();
    ticks.target_count = 6;
    ticks.min_pixel_spacing = 92.0f;
    ticks.minor_per_interval = 3;
    if (dvz_axis_set_tick_policy(x_axis, &ticks) != DVZ_OK || dvz_axis_set_tick_policy(y_axis, &ticks) != DVZ_OK)
        return false;

    ExampleAxisStyleOptions style = example_graphite_cyan_axis_options();
    style.tick_size_px = 10.0f;
    style.label_size_px = 13.0f;
    style.tick_gap_px = 6.0f;
    style.x_label_gap_px = x_label_gap_px;
    style.y_label_gap_px = 18.0f;
    style.grid_alpha = 105;
    if (!example_graphite_cyan_apply_axis_style(x_axis, false, &style))
        return false;
    if (!example_graphite_cyan_apply_axis_style(y_axis, true, &style))
        return false;
    if (dvz_axis_set_grid(x_axis, true) != DVZ_OK || dvz_axis_set_grid(y_axis, show_y_axis) != DVZ_OK)
        return false;
    if (dvz_axis_set_visible(y_axis, show_y_axis) != DVZ_OK)
        return false;
    if (x_label != NULL && dvz_axis_set_label(x_axis, x_label) != DVZ_OK)
        return false;
    if (show_y_axis && y_label != NULL && dvz_axis_set_label(y_axis, y_label) != DVZ_OK)
        return false;
    return true;
}


/**
 * Configure one showcase panel.
 *
 * @param panel target panel
 * @return true when the panel was configured
 */
static bool _configure_panel(DvzPanel* panel)
{
    example_graphite_cyan_set_panel_background(panel);

    DvzColor color = example_graphite_cyan_color(EXAMPLE_STYLE_COLOR_GRID);
    color.a = 220u;
    DvzPanelBorderDesc border = dvz_panel_border_desc();
    border.color = color;
    border.width_px = 2.0f;
    border.inset_px = 1.0f;
    return dvz_panel_set_border(panel, &border) == DVZ_OK;
}


/**
 * Set a panel data domain.
 *
 * @param panel target panel
 * @param x0 X minimum
 * @param x1 X maximum
 * @param y0 Y minimum
 * @param y1 Y maximum
 * @return true when both domains were set
 */
static bool _set_domain(DvzPanel* panel, double x0, double x1, double y0, double y1)
{
    return dvz_panel_set_domain(panel, DVZ_DIM_X, x0, x1) == 0 &&
           dvz_panel_set_domain(panel, DVZ_DIM_Y, y0, y1) == 0;
}


/**
 * Add the autocorrelogram panel using bars and guide annotations.
 *
 * @param scene scene owning visuals
 * @param panel target panel
 * @return true when the panel was populated
 */
static bool _add_autocorrelogram(DvzScene* scene, DvzPanel* panel)
{
    (void)scene;
    double starts[CORR_BINS] = {0};
    double ends[CORR_BINS] = {0};
    double values[CORR_BINS] = {0};
    _fill_autocorrelogram(starts, ends, values);

    DvzBarsDesc bars_desc = dvz_bars_desc();
    bars_desc.fill_color = dvz_color_rgba(76, 201, 240, 185);
    bars_desc.outline_color = dvz_color_rgba(76, 201, 240, 75);
    bars_desc.outline_width_px = 0.8f;
    bars_desc.gap_fraction = 0.08f;
    DvzBars* bars = dvz_bars(panel, &bars_desc);
    if (bars == NULL || dvz_bars_set_intervals(bars, starts, ends, values, CORR_BINS) != 0)
        return false;

    DvzGuideSpanDesc span_desc = dvz_guide_span_desc();
    span_desc.orientation = DVZ_GUIDE_ORIENTATION_VERTICAL;
    span_desc.min_value = -2.0;
    span_desc.max_value = 2.0;
    span_desc.fill_color = dvz_color_rgba(239, 71, 111, 42);
    span_desc.outline_color = dvz_color_rgba(239, 71, 111, 165);
    span_desc.outline_width_px = 1.5f;
    if (dvz_guide_span(panel, &span_desc) == NULL)
        return false;

    DvzGuideLineDesc baseline = dvz_guide_line_desc();
    baseline.orientation = DVZ_GUIDE_ORIENTATION_HORIZONTAL;
    baseline.value = 38.0;
    baseline.color = dvz_color_rgba(128, 255, 219, 220);
    baseline.stroke_width_px = 2.25f;
    if (dvz_guide_line(panel, &baseline) == NULL)
        return false;

    DvzGuideLineDesc zero = dvz_guide_line_desc();
    zero.orientation = DVZ_GUIDE_ORIENTATION_VERTICAL;
    zero.value = 0.0;
    zero.color = dvz_color_rgba(255, 183, 3, 220);
    zero.stroke_width_px = 2.0f;
    if (dvz_guide_line(panel, &zero) == NULL)
        return false;

    DvzColor text = example_graphite_cyan_color(EXAMPLE_STYLE_COLOR_TEXT);
    text.a = 235u;
    DvzColor baseline_text = example_graphite_cyan_color(EXAMPLE_STYLE_COLOR_ACCENT_SECONDARY);
    baseline_text.a = 235u;

    DvzTextStyle style = example_graphite_cyan_text_style(EXAMPLE_STYLE_TEXT_PANEL_LABEL);
    style.renderer = DVZ_TEXT_RENDERER_MSDF_ATLAS;
    DvzTextPlacement placement = dvz_text_placement();
    placement.mode = DVZ_TEXT_PLACEMENT_DATA;
    placement.text_anchor[0] = 0.5f;
    placement.text_anchor[1] = 0.5f;
    placement.has_text_anchor = true;
    placement.depth_test = false;

    DvzLabelDesc label = dvz_label_desc();
    label.text = "bi-side refractory";
    style.color[0] = text.r;
    style.color[1] = text.g;
    style.color[2] = text.b;
    style.color[3] = text.a;
    placement.position[0] = 0.0f;
    placement.position[1] = 112.0f;
    placement.position[2] = 0.0f;
    placement.offset[0] = 0.0f;
    placement.offset[1] = 0.0f;
    DvzAnnotation* annotation = dvz_annotation_label(panel, &label);
    if (annotation == NULL || dvz_annotation_set_style(annotation, &style) != 0 ||
        dvz_annotation_set_placement(annotation, &placement) != 0)
        return false;

    label.text = "baseline";
    style.color[0] = baseline_text.r;
    style.color[1] = baseline_text.g;
    style.color[2] = baseline_text.b;
    style.color[3] = baseline_text.a;
    placement.position[0] = -30.0f;
    placement.position[1] = 38.0f;
    placement.position[2] = 0.0f;
    placement.offset[0] = 0.0f;
    placement.offset[1] = -14.0f;
    annotation = dvz_annotation_label(panel, &label);
    return annotation != NULL && dvz_annotation_set_style(annotation, &style) == 0 &&
           dvz_annotation_set_placement(annotation, &placement) == 0;
}


/**
 * Fill mean path and uncertainty bounds.
 *
 * @param x output X coordinates
 * @param lower output lower bounds
 * @param upper output upper bounds
 * @param center output center line values
 */
static void _fill_mean_error(
    double x[MEAN_COUNT], double lower[MEAN_COUNT], double upper[MEAN_COUNT],
    double center[MEAN_COUNT])
{
    for (uint32_t i = 0; i < MEAN_COUNT; i++)
    {
        const float t = (float)i / (float)(MEAN_COUNT - 1u);
        const float y = 1.1f + 0.42f * sinf(TAU * (0.82f * t + 0.08f)) +
                        0.18f * sinf(TAU * (2.4f * t + 0.42f));
        const float e = 0.14f + 0.06f * sinf(TAU * (1.7f * t + 0.20f));
        x[i] = 10.0 * (double)t;
        center[i] = (double)y;
        lower[i] = (double)(y - e);
        upper[i] = (double)(y + e);
    }
}


/**
 * Add the mean path and translucent error band panel.
 *
 * @param scene scene owning visuals
 * @param panel target panel
 * @return true when the panel was populated
 */
static bool _add_mean_error(DvzScene* scene, DvzPanel* panel)
{
    (void)scene;
    double x[MEAN_COUNT] = {0};
    double lower[MEAN_COUNT] = {0};
    double upper[MEAN_COUNT] = {0};
    double center[MEAN_COUNT] = {0};
    _fill_mean_error(x, lower, upper, center);

    DvzBandDesc desc = dvz_band_desc();
    desc.fill_color = dvz_color_rgba(128, 255, 219, 58);
    desc.line_color = dvz_color_rgba(76, 201, 240, 255);
    desc.line_width_px = 5.5f;
    DvzBand* band = dvz_band(panel, &desc);
    return band != NULL && dvz_band_set_bounds(band, x, lower, upper, MEAN_COUNT) == 0 &&
           dvz_band_set_center(band, x, center, MEAN_COUNT) == 0;
}


/**
 * Fill high-density stacked traces.
 *
 * @param positions output positions
 * @param colors output colors
 * @param widths output widths
 * @param subpaths output subpath lengths
 */
static void _fill_stacked_traces(vec3 positions[TRACE_VERTEX_COUNT],
                                 DvzColor colors[TRACE_VERTEX_COUNT],
                                 float widths[TRACE_VERTEX_COUNT],
                                 uint32_t subpaths[TRACE_COUNT])
{
    for (uint32_t ch = 0; ch < TRACE_COUNT; ch++)
    {
        const float row = (float)(TRACE_COUNT - 1u - ch);
        const float phase = (float)ch / (float)TRACE_COUNT;
        DvzColor color = _trace_color(ch);
        subpaths[ch] = TRACE_SAMPLES;
        for (uint32_t i = 0; i < TRACE_SAMPLES; i++)
        {
            const float t = (float)i / (float)(TRACE_SAMPLES - 1u);
            const float y = row + 0.19f * sinf(TAU * ((2.1f + 0.035f * (float)ch) * t + phase)) +
                            0.055f * sinf(TAU * (27.0f * t + 0.11f * (float)ch)) +
                            0.035f * cosf(TAU * (53.0f * t + 0.07f * (float)ch));
            const uint32_t k = ch * TRACE_SAMPLES + i;
            positions[k][0] = 10.0f * t;
            positions[k][1] = y;
            positions[k][2] = 0.0f;
            colors[k] = color;
            widths[k] = ch == 0u || ch == TRACE_COUNT - 1u ? 1.9f : 1.55f;
        }
    }
}


/**
 * Add the stacked 32-trace panel.
 *
 * @param scene scene owning visuals
 * @param panel target panel
 * @return true when the panel was populated
 */
static bool _add_stacked_traces(DvzScene* scene, DvzPanel* panel)
{
    vec3 positions[TRACE_VERTEX_COUNT] = {{0}};
    DvzColor colors[TRACE_VERTEX_COUNT] = {{0}};
    float widths[TRACE_VERTEX_COUNT] = {0};
    uint32_t subpaths[TRACE_COUNT] = {0};
    _fill_stacked_traces(positions, colors, widths, subpaths);

    DvzGuideLineDesc cursor = dvz_guide_line_desc();
    cursor.orientation = DVZ_GUIDE_ORIENTATION_VERTICAL;
    cursor.value = 5.0;
    cursor.color = dvz_color_rgba(76, 201, 240, 200);
    cursor.stroke_width_px = 1.75f;
    cursor.label = "probe";
    if (dvz_guide_line(panel, &cursor) == NULL)
        return false;

    DvzVisual* traces = dvz_path(scene, 0);
    if (traces == NULL)
        return false;
    DvzVisualDataUpdate updates[] = {
        {.attr_name = "position", .data = positions, .item_count = TRACE_VERTEX_COUNT},
        {.attr_name = "color", .data = colors, .item_count = TRACE_VERTEX_COUNT},
        {.attr_name = "stroke_width_px", .data = widths, .item_count = TRACE_VERTEX_COUNT},
    };
    if (dvz_visual_set_data_many(traces, updates, 3) != 0)
        return false;
    if (dvz_path_set_subpaths(traces, TRACE_COUNT, subpaths) != 0)
        return false;
    if (dvz_path_set_caps(traces, DVZ_SEGMENT_CAP_ROUND, DVZ_SEGMENT_CAP_ROUND) != 0)
        return false;
    if (dvz_path_set_join(traces, DVZ_PATH_JOIN_ROUND, 4.0f) != 0)
        return false;
    if (dvz_visual_set_depth_test(traces, false) != 0)
        return false;
    return _add_data_visual(panel, traces, 1);
}


/*************************************************************************************************/
/*  Scenario callbacks                                                                           */
/*************************************************************************************************/

/**
 * Initialize the scientific plotting showcase.
 *
 * @param ctx scenario context
 * @param out_user scenario state output
 * @return true on success
 */
static bool _scenario_init(DvzScenarioContext* ctx, void** out_user)
{
    if (ctx == NULL)
        return false;
    if (out_user != NULL)
        *out_user = NULL;

    ctx->figure = dvz_figure(ctx->scene, ctx->width, ctx->height, 0);
    if (ctx->figure == NULL)
        return false;

    DvzGrid* grid = dvz_figure_grid(ctx->figure, 2, 2);
    if (grid == NULL)
        return false;
    if (dvz_grid_set_margins(
            grid, &(DvzPanelReserve){.left_px = 24.0f, .right_px = 24.0f, .top_px = 18.0f,
                                     .bottom_px = 24.0f}) != DVZ_OK)
        return false;
    if (dvz_grid_set_gutter(grid, 24.0f, 34.0f) != DVZ_OK)
        return false;

    DvzPanel* correlogram = dvz_grid_panel(grid, 0, 0);
    DvzPanel* mean_error = dvz_grid_panel(grid, 0, 1);
    DvzPanel* stacked = dvz_grid_panel_span(grid, 1, 0, 1, 2);
    if (correlogram == NULL || mean_error == NULL || stacked == NULL)
        return false;

    if (!_configure_panel(correlogram) || !_configure_panel(mean_error) || !_configure_panel(stacked))
        return false;

    if (!_set_domain(correlogram, -50.0, 50.0, 0.0, 125.0))
        return false;
    if (!_set_domain(mean_error, 0.0, 10.0, 0.35, 1.95))
        return false;
    if (!_set_domain(stacked, 0.0, 10.0, -0.85, 31.85))
        return false;

    if (dvz_panel_set_reserve(
            stacked, &(DvzPanelReserve){.left_px = 56.0f, .right_px = 16.0f}) != DVZ_OK)
        return false;

    if (!_add_autocorrelogram(ctx->scene, correlogram) ||
        !_add_mean_error(ctx->scene, mean_error) ||
        !_add_stacked_traces(ctx->scene, stacked))
        return false;

    if (!_add_axes(correlogram, "lag (ms)", "coincidence count", true, 18.0f))
        return false;
    if (!_add_axes(mean_error, "time (s)", "response", true, 18.0f))
        return false;
    if (!_add_axes(stacked, "time (s)", NULL, false, 18.0f))
        return false;

    return dvz_scenario_panzoom(ctx, correlogram, NULL, DVZ_DIM_MASK_XY) != NULL &&
           dvz_scenario_panzoom(ctx, mean_error, NULL, DVZ_DIM_MASK_XY) != NULL &&
           dvz_scenario_panzoom(ctx, stacked, NULL, DVZ_DIM_MASK_X) != NULL;
}


/**
 * Return the scientific plotting scenario specification.
 *
 * @return scenario specification
 */
DvzScenarioSpec dvz_showcase_scientific_plotting_scenario(void)
{
    return (DvzScenarioSpec){
        .id = "showcases_scientific_plotting",
        .title = "Scientific Plotting Workflow",
        .width = WIDTH,
        .height = HEIGHT,
        .fps = 60.0,
        .requirements = DVZ_SCENARIO_REQ_TEXT_VISUAL | DVZ_SCENARIO_REQ_CONTROLLER |
                        DVZ_SCENARIO_REQ_PANZOOM,
        .init = _scenario_init,
    };
}


/*************************************************************************************************/
/*  Functions                                                                                    */
/*************************************************************************************************/

/**
 * Run the scientific plotting showcase through the native scenario runner.
 *
 * @param argc command-line argument count
 * @param argv command-line argument vector
 * @return process exit code
 */
#ifndef DVZ_EXAMPLE_NO_MAIN
int main(int argc, char** argv)
{
    DvzScenarioSpec spec = dvz_showcase_scientific_plotting_scenario();
    return dvz_scenario_run_native_cli(&spec, argc, argv) == 0 ? 0 : 1;
}
#endif
Example details
- ID:
showcases_scientific_plotting - Category:
showcase - Lane:
showcases - Status:
supported - Source:
examples/c/showcases/scientific_plotting.c - Approved adaptation starter:
no - Python source:
examples/python/gallery/showcases/scientific_plotting.py - Python adaptation: Available
- Browser support: Live in browser
- WebGPU live route:
examples/webgpu/live.html?id=showcases_scientific_plotting - Browser capability tags:
axes,primitive,segment,path,text,panzoom - Validation:
smoke+screenshot
Tags
workflow, scientific, histogram, guide-lines, guide-spans, stacked-traces, uncertainty-band
Data
| Field | Value |
|---|---|
kind |
synthetic |