Add Colorbars, Scale Bars, and Legends
Add visual context without turning the adornment into primary data.
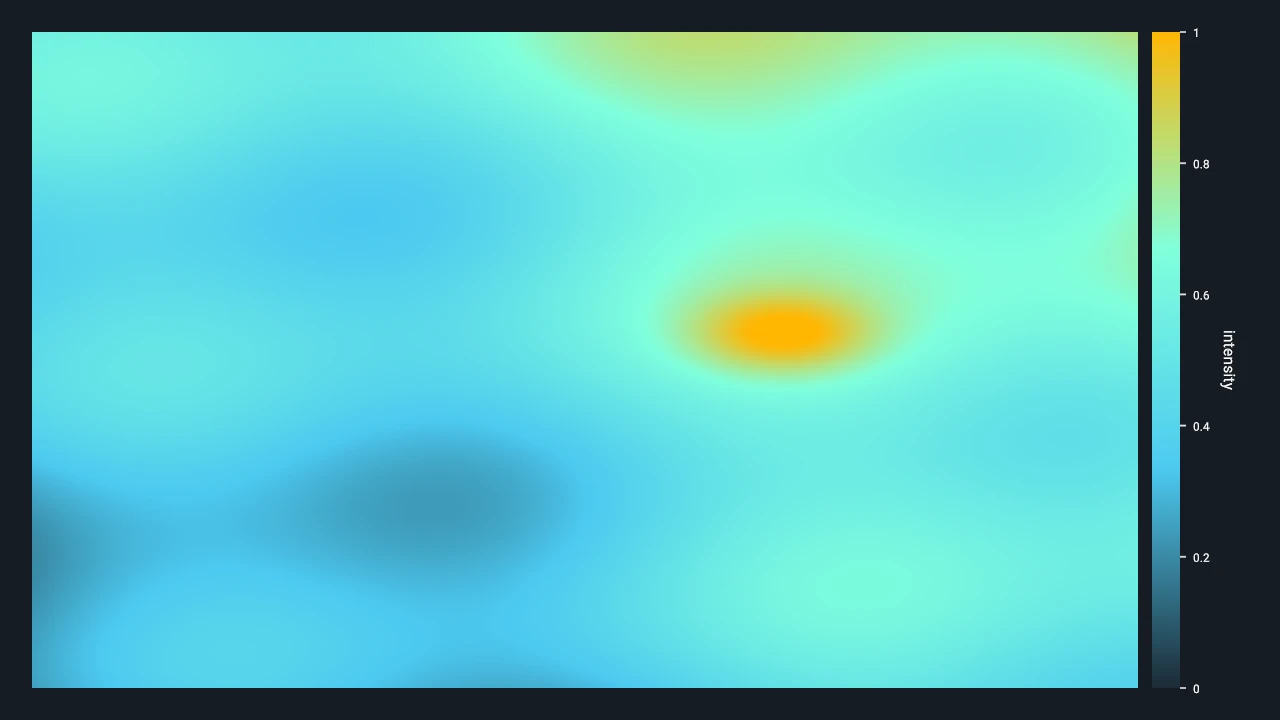
At a glance
Status: Supported retained colorbar, scale-bar, and legend helpers · Languages: Python and C Prerequisites: A panel and the same scale/units/category state used by its data visual Result: Context that remains synchronized with the visual encoding it explains
Task workflow
Choose the adornment that explains the visual encoding: colorbars for scalar color, scale bars for spatial units, legends for categorical encodings. Add it after the data visual and keep its range or labels synchronized with the visual.
| Need | Use | Keep synchronized with |
|---|---|---|
| Show how scalar values map to a colormap. | Colorbar | The same continuous DvzScale, normalization, format, and title used by the visual. |
| Show physical or data distance in the panel. | Scale bar | The panel domain, controller-visible extent, measured dimension, and unit conversion. |
| Show category names and colors. | Legend | The same categorical DvzScale, category IDs, colors, labels, ordering, and highlight state. |
| Show coordinate ticks and grid lines. | Axes | The panel domain, units, tick policy, and panzoom-linked visible range. |
| Show a local note or dynamic sampled value. | Annotation or readout | The data item, sampled field, query result, and any colorbar or unit formatting it references. |
Use this page for the overview. Use Add axes, Add text, labels, and annotations, Map scalar values with colormaps, and Probe image or field values for the specialized workflows.
Minimal call-sequence excerpts
These excerpts assume a live panel and the required continuous or categorical scale. Constructors
may return NULL, and the setters return DvzResult; complete examples should check both. The
canonical sources are linked under Related examples below.
import datoviz as dvz

colorbar = dvz.dvz_colorbar(panel, scale, None)
if not colorbar:
    raise RuntimeError("dvz_colorbar() failed")
dvz.dvz_colorbar_set_title(colorbar, b"Intensity")
DvzColorbar* colorbar = dvz_colorbar(panel, scale, NULL);
dvz_colorbar_set_title(colorbar, "Intensity");
DvzScaleBar* scalebar = dvz_scale_bar(panel, NULL);
dvz_scale_bar_set_dimension(scalebar, DVZ_DIM_X);
dvz_scale_bar_set_anchor(scalebar, DVZ_SCENE_ANCHOR_PANEL_BOTTOM_RIGHT);
DvzLegend* legend = dvz_legend(panel, categorical_scale, NULL);
dvz_legend_set_title(legend, "Category");
Create the data visual first, then attach the adornment to the same panel:
dvz_panel_add_visual(panel, visual, NULL);
Colorbars require a continuous scale. Legends require a categorical scale. Scale bars describe one panel dimension and should match the panel's domain and units.
The expected result is an attached adornment at its default panel edge. It is retained panel state;
users do not add colorbars, legends, or scale bars with dvz_panel_add_visual().
Important details
Adornments should describe the current visual encoding. If the scalar normalization, unit scale, or category set changes, update the adornment at the same time.
Colorbars and legends are scale views, not independent encodings. Create the DvzScale once, bind
it to the visual, then pass that same scale to the colorbar or legend. Do not recreate colors,
labels, limits, or category ordering separately for the adornment.
Scale bars measure visible distance. For a 2D panzoom panel, the scale bar should track the controller-visible domain. For 3D or camera-facing measurements, choose the scale-bar reference mode deliberately and verify the result against the camera convention.
Attached colorbars and legends reserve space at a panel edge. Use panel-left or panel-right anchors for vertical colorbars, and panel-top or panel-bottom anchors for horizontal colorbars. Detached placement is useful for composed layouts, but it should still be visually tied to the data it explains.
In multi-panel figures, prefer one adornment per independently encoded panel. Share an adornment only when the panels truly share the same scale, category table, units, and visible-domain policy.
Colorbars and legends have dedicated destroy functions. A DvzScaleBar is a typed annotation
alias; cast it to DvzAnnotation* when calling dvz_annotation_destroy().
Probe readouts are a common source of subtle errors. If a cursor readout describes a color-mapped field, it should sample the same field and use the same normalization and display format as the colorbar.
Choosing placement
| Placement choice | Use when | Watch for |
|---|---|---|
| Panel edge, attached | The adornment is part of the panel layout and should not cover data. | Attached anchors are constrained to supported panel edges. |
| Panel corner, overlay | The panel has spare interior space and the context is compact. | Avoid hiding dense marks, labels, or important extrema. |
| Detached placement | A composed figure needs a shared legend, large colorbar, or custom layout. | Make the visual association obvious and keep the scale contract shared. |
| Data/world anchored annotation | The note refers to a specific item, point, or measurement. | It may move, clip, or become unreadable under navigation. |
Common mistakes
- Showing a colorbar for arbitrary RGBA colors.
- Building a colorbar or legend from duplicated colors instead of the visual's scale.
- Showing one legend for panels that use different category mappings.
- Letting a scale bar drift from the panel domain after zoom or unit changes.
- Mixing data units, display units, and SI-prefix formatting without an explicit
DvzUnitssetup. - Placing an attached colorbar on an edge that disagrees with its orientation.
- Letting an overlay adornment cover the data pattern it is meant to explain.
- Using a long showcase as copied starter code instead of the minimal feature example.
See also
- Map scalar values with colormaps
- Add axes
- Add text, labels, and annotations
- Probe image or field values
- Link panels and controllers
Complete and related examples
- Canonical complete example: Colorbar - Source:
examples/c/features/colorbar.c - Scale Bar - Source:
examples/c/features/scalebar.c - Categorical Legend - Source:
examples/c/features/legend_categorical.c - Linked Probe With Colorbar - Source:
examples/c/showcases/linked_probe_colorbar.c - Scale-Aware Measurement Workflow - Source:
examples/c/showcases/scalebar_measurement.c