Point
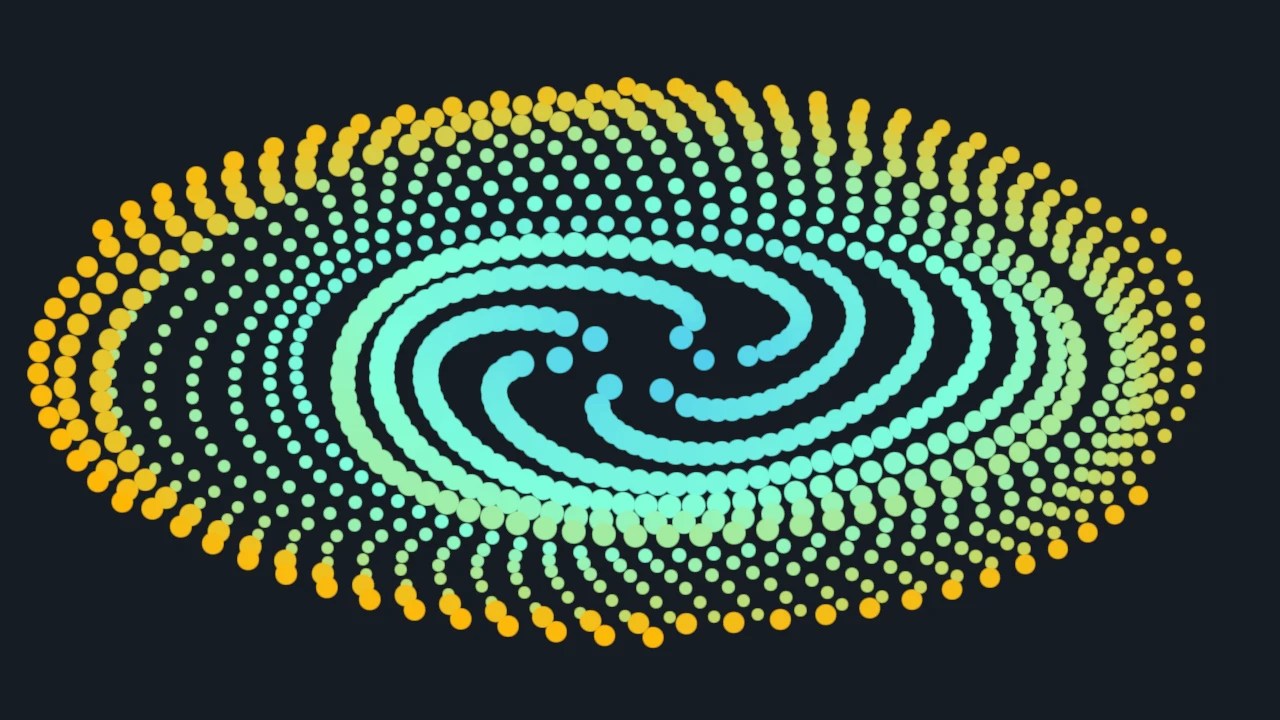
This example renders a 2D scatter plot with per-point color and diameter.
Preview
Run And Adapt
Commands below assume a Datoviz source checkout and start at the repository root. Use your configured build environment; Python routes additionally require local bindings.
| Route | Availability | Command or action |
|---|---|---|
| C | Canonical native source | just example-c visuals/point (build and run), or rerun ./build/examples/c/visuals/point |
| Python | Available; manually maintained direct-engine example | python3 -m examples.python.gallery.visuals.point |
| Browser | Live WebGPU route | Open live example |
This example is approved as a starting point for user code and coding agents. Keep the object lifetimes and data shapes intact while adapting the data and styling.
What To Look For
Generated positions place the samples, scalar values are mapped through a color scale, and diameters vary each point's screen-space size. Compare dense and sparse parts of the cloud to see how a beginner scatter plot can show location, magnitude, and emphasis with three simple arrays.
Source
#!/usr/bin/env python3
"""2D point visual with scalar-derived color and per-point diameter."""

from __future__ import annotations

import numpy as np

import datoviz as dvz

from examples.python.gallery import common as ex


POINT_COUNT = 960
TAU = 2.0 * np.pi


def main() -> None:
    scene, figure, panel = ex.scene_panel()

    i = np.arange(POINT_COUNT, dtype=np.float32)
    arm = np.mod(i, 6.0)
    local = np.floor(i / 6.0) / (POINT_COUNT / 6.0)
    theta = TAU * (2.10 * local + arm / 6.0)
    radius = 0.10 + 0.82 * np.sqrt(local)
    ripple = 0.040 * np.sin(TAU * (3.0 * local + 0.13 * arm))

    positions = np.zeros((POINT_COUNT, 3), dtype=np.float32)
    positions[:, 0] = (radius + ripple) * np.cos(theta)
    positions[:, 1] = 0.84 * (radius - 0.5 * ripple) * np.sin(theta)

    band = 0.5 + 0.5 * np.sin(TAU * (i / (POINT_COUNT - 1) + 0.08 * arm))
    values = np.clip(0.12 + 0.76 * (0.25 + 0.75 * np.sqrt(local)) + 0.12 * band, 0.0, 1.0)
    colors = np.column_stack(
        [
            (40 + 80 * values).astype(np.uint8),
            (100 + 130 * values).astype(np.uint8),
            (180 + 60 * (1.0 - values)).astype(np.uint8),
            np.full(POINT_COUNT, 230, dtype=np.uint8),
        ]
    )
    diameters = (10.0 + 11.0 * band + 5.0 * (1.0 - local)).astype(np.float32)

    point = dvz.dvz_point(scene, 0)
    if not point:
        raise RuntimeError("dvz_point() failed")
    dvz.dvz_visual_set_data_many(
        point,
        {
            "position": positions,
            "color": colors,
            "diameter_px": diameters,
        },
    )
    ex.set_filled_point_style(point)
    dvz.dvz_visual_set_depth_test(point, False)
    dvz.dvz_visual_set_alpha_mode(point, dvz.DVZ_ALPHA_BLENDED)
    ex.add_visual(panel, point)

    ex.run_with_view(
        scene,
        figure,
        "Point",
        lambda view: ex.bind_panzoom(view, scene, panel, dvz.DVZ_DIM_MASK_XY),
    )


if __name__ == "__main__":
    main()
/*
 * Copyright (c) 2021 Cyrille Rossant and contributors. All rights reserved.
 * Licensed under the MIT license. See LICENSE file in the project root for details.
 * SPDX-License-Identifier: MIT
 */

/* point - This example renders a 2D scatter plot with per-point color and diameter.
 *
 * What to look for: generated positions place the samples, scalar values are mapped through a
 * color scale, and diameters vary each point's screen-space size. Compare dense and sparse parts
 * of the cloud to see how a beginner scatter plot can show location, magnitude, and emphasis with
 * three simple arrays.
 *
 * Scenario: visuals_point
 * Style: visuals, graphite_cyan, 1280x720 window target
 *
 * Build:  just example-c visuals/point
 * Run:    ./build/examples/c/visuals/point --live
 * Smoke:  ./build/examples/c/visuals/point --png
 */


/*************************************************************************************************/
/*  Includes                                                                                     */
/*************************************************************************************************/

#include <math.h>
#include <stdbool.h>
#include <stdint.h>

#include "_alloc.h"
#include "_assertions.h"
#include "datoviz/scene.h"
#include "example_style.h"
#include "runner/scenario_runner.h"


/*************************************************************************************************/
/*  Constants                                                                                    */
/*************************************************************************************************/

#define WIDTH  EXAMPLE_WINDOW_WIDTH
#define HEIGHT EXAMPLE_WINDOW_HEIGHT
#define POINT_COUNT 960u

static const float TAU = 6.28318530718f;


/*************************************************************************************************/
/*  Forward declarations                                                                         */
/*************************************************************************************************/

DvzScenarioSpec dvz_visual_point_scenario(void);


/*************************************************************************************************/
/*  Structs                                                                                      */
/*************************************************************************************************/

typedef struct PointVisualState
{
    vec3* positions;
    float* values;
    float* diameters;
} PointVisualState;


/*************************************************************************************************/
/*  Helpers                                                                                      */
/*************************************************************************************************/

/**
 * Fill one deterministic compact point cloud.
 *
 * @param positions output point positions
 * @param values output point scalar values
 * @param diameters output point diameters in pixels
 */
static void _fill_points(
    vec3 positions[POINT_COUNT], float values[POINT_COUNT], float diameters[POINT_COUNT])
{
    ANN(positions);
    ANN(values);
    ANN(diameters);

    for (uint32_t i = 0; i < POINT_COUNT; i++)
    {
        const float t = POINT_COUNT > 1u ? (float)i / (float)(POINT_COUNT - 1u) : 0.0f;
        const float arm = (float)(i % 6u);
        const float local = (float)(i / 6u) / (float)(POINT_COUNT / 6u);
        const float theta = TAU * (2.10f * local + arm / 6.0f);
        const float radius = 0.10f + 0.82f * sqrtf(local);
        const float ripple = 0.040f * sinf(TAU * (3.0f * local + 0.13f * arm));

        positions[i][0] = (radius + ripple) * cosf(theta);
        positions[i][1] = 0.84f * (radius - 0.5f * ripple) * sinf(theta);
        positions[i][2] = 0.0f;

        const float band = 0.5f + 0.5f * sinf(TAU * (t + 0.08f * arm));
        const float mix = 0.25f + 0.75f * sqrtf(local);
        values[i] = fminf(1.0f, 0.12f + 0.76f * mix + 0.12f * band);

        diameters[i] = 10.0f + 11.0f * band + 5.0f * (1.0f - local);
    }
}


/**
 * Upload the point arrays to one retained visual.
 *
 * @param visual point visual
 * @param positions point positions
 * @param values point scalar values
 * @param diameters point diameters
 * @return true when all uploads succeed
 */
static bool _upload_points(
    DvzVisual* visual, vec3 positions[POINT_COUNT], float values[POINT_COUNT],
    float diameters[POINT_COUNT])
{
    ANN(visual);
    ANN(positions);
    ANN(values);
    ANN(diameters);

    DvzVisualDataUpdate updates[] = {
        {.attr_name = "position", .data = positions, .item_count = POINT_COUNT},
        {.attr_name = "color", .data = values, .item_count = POINT_COUNT},
        {.attr_name = "diameter_px", .data = diameters, .item_count = POINT_COUNT},
    };
    return dvz_visual_set_data_many(visual, updates, 3) == 0;
}


/**
 * Free the retained point buffers.
 *
 * @param state point visual state
 */
static void _free_state(PointVisualState* state)
{
    if (state == NULL)
        return;
    dvz_free(state->diameters);
    dvz_free(state->values);
    dvz_free(state->positions);
    dvz_free(state);
}


/*************************************************************************************************/
/*  Scenario callbacks                                                                           */
/*************************************************************************************************/

/**
 * Initialize the retained 2D point visual scenario.
 *
 * @param ctx scenario context
 * @param out_user scenario state output
 * @return true on success
 */
static bool _scenario_init(DvzScenarioContext* ctx, void** out_user)
{
    if (ctx == NULL)
        return false;
    if (out_user != NULL)
        *out_user = NULL;

    PointVisualState* state = (PointVisualState*)dvz_calloc(1, sizeof(*state));
    if (state == NULL)
        return false;

    state->positions = (vec3*)dvz_calloc(POINT_COUNT, sizeof(*state->positions));
    state->values = (float*)dvz_calloc(POINT_COUNT, sizeof(*state->values));
    state->diameters = (float*)dvz_calloc(POINT_COUNT, sizeof(*state->diameters));
    if (state->positions == NULL || state->values == NULL || state->diameters == NULL)
        goto error;

    _fill_points(state->positions, state->values, state->diameters);

    ctx->figure = dvz_figure(ctx->scene, ctx->width, ctx->height, 0);
    if (ctx->figure == NULL)
        goto error;

    DvzPanel* panel = dvz_panel_full(ctx->figure);
    if (panel == NULL)
        goto error;
    example_graphite_cyan_set_panel_background(panel);

    DvzVisual* point = dvz_point(ctx->scene, 0);
    if (point == NULL)
        goto error;

    int rc = dvz_visual_set_attr_format(point, "color", DVZ_VISUAL_ATTR_FORMAT_SCALAR_F32);
    if (rc != 0)
        goto error;

    DvzScale* scale = example_graphite_cyan_color_scale(ctx->scene, 0.0, 1.0);
    if (scale == NULL)
        goto error;

    rc = dvz_visual_set_scale(point, "color", scale);
    if (rc != 0)
        goto error;

    if (!_upload_points(point, state->positions, state->values, state->diameters))
        goto error;

    DvzPointStyleDesc style = dvz_point_style_desc();
    style.aspect = DVZ_SHAPE_ASPECT_FILLED;
    style.stroke_width_px = 0.0f;
    rc = dvz_point_set_style(point, &style);
    if (rc != 0)
        goto error;

    rc = dvz_visual_set_depth_test(point, false);
    if (rc != 0)
        goto error;

    rc = dvz_visual_set_alpha_mode(point, DVZ_ALPHA_BLENDED);
    if (rc != 0)
        goto error;

    rc = dvz_panel_add_visual(panel, point, NULL);
    if (rc != 0)
        goto error;

    DvzPanzoom* panzoom = dvz_scenario_panzoom(ctx, panel, NULL, DVZ_DIM_MASK_XY);
    if (panzoom == NULL)
        goto error;

    if (out_user != NULL)
        *out_user = state;
    return true;

error:
    _free_state(state);
    return false;
}


/**
 * Destroy the retained 2D point visual scenario state.
 *
 * @param ctx scenario context
 * @param user scenario state
 */
static void _scenario_destroy(DvzScenarioContext* ctx, void* user)
{
    (void)ctx;
    _free_state((PointVisualState*)user);
}


/**
 * Return the point visual scenario specification.
 *
 * @return scenario specification
 */
DvzScenarioSpec dvz_visual_point_scenario(void)
{
    return (DvzScenarioSpec){
        .id = "visuals_point",
        .title = "Point",
        .width = WIDTH,
        .height = HEIGHT,
        .fps = 60.0,
        .init = _scenario_init,
        .destroy = _scenario_destroy,
    };
}


/*************************************************************************************************/
/*  Functions                                                                                    */
/*************************************************************************************************/

/**
 * Run the retained 2D point visual example through the native scenario runner.
 *
 * @param argc command-line argument count
 * @param argv command-line argument vector
 * @return process exit code
 */
#ifndef DVZ_EXAMPLE_NO_MAIN
int main(int argc, char** argv)
{
    DvzScenarioSpec spec = dvz_visual_point_scenario();
    return dvz_scenario_run_native_cli(&spec, argc, argv) == 0 ? 0 : 1;
}
#endif
Example details
- ID:
visuals_point - Category:
visual - Lane:
visuals - Status:
supported - Source:
examples/c/visuals/point.c - Approved adaptation starter:
yes - Reference: Point visual family
- Python source:
examples/python/gallery/visuals/point.py - Python adaptation: Available; manually maintained direct-engine example
- Browser support: Live in browser
- WebGPU live route:
examples/webgpu/live.html?id=visuals_point - Browser capability tags:
point,panzoom - Validation:
smoke+screenshot
Tags
point, panzoom, capture
Data
| Field | Value |
|---|---|
kind |
synthetic |