Linked Panels With Axes
This example builds linked time-series panels with shared axes behavior.
Preview
Run And Adapt
Commands below assume a Datoviz source checkout and start at the repository root. Use your configured build environment; Python routes additionally require local bindings.
| Route | Availability | Command or action |
|---|---|---|
| C | Canonical native source | just example-c showcases/panel_linked_axes (build and run), or rerun ./build/examples/c/showcases/panel_linked_axes |
| Python | Available; direct-engine adaptation | python3 -m examples.python.gallery.showcases.panel_linked_axes |
| Browser | Live WebGPU route | Open live example |
Use this example as capability or integration evidence, not as a minimal copy-paste template. Start from the nearest supported, copy-safe example and add this feature after verifying the linked API reference.
What To Look For
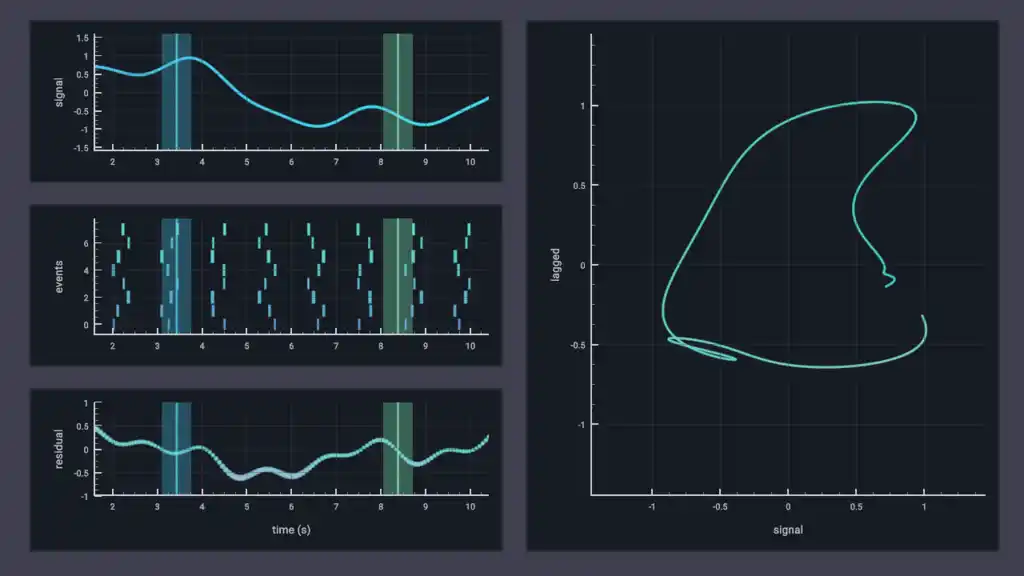
The left column combines a synthetic signal trace, an event-raster panel, and residual points, while the right panel summarizes the same time range. The important arrays are the path samples, event segments, residual points, shaded bands, and cursor lines; compare the panels to see that they use different y domains while their x navigation remains linked.
This workflow is useful for scientific dashboards where traces, events, and summary statistics must stay aligned during panzoom interaction.
Source
#!/usr/bin/env python3
"""Linked time-series panels with shared X navigation and retained axes."""

from __future__ import annotations

import ctypes

import numpy as np

import datoviz as dvz

from examples.python.gallery import common as ex


PATH_COUNT = 360
EVENT_COUNT = 96
EVENT_ROWS = 8
POINT_COUNT = 168
PHASE_COUNT = 360
BAND_COUNT = 2
CURSOR_COUNT = BAND_COUNT
TAU = 2.0 * np.pi


def _signal(t):
    return (
        0.85 * np.sin(TAU * (1.08 * t + 0.06))
        + 0.34 * np.sin(TAU * (3.20 * t + 0.18))
        + 0.12 * np.cos(TAU * (6.00 * t + 0.10))
    )


def _lagged_signal(t):
    return 0.76 * np.sin(TAU * (1.08 * t - 0.09)) + 0.30 * np.sin(
        TAU * (2.50 * t + 0.32)
    )


def _signal_data():
    t = np.linspace(0.0, 1.0, PATH_COUNT, dtype=np.float32)
    positions = np.column_stack((12.0 * t, _signal(t), np.zeros(PATH_COUNT))).astype(np.float32)
    colors = np.empty((PATH_COUNT, 4), dtype=np.uint8)
    colors[:, 0] = 72
    colors[:, 1] = np.clip(188.0 + 44.0 * t, 0, 255).astype(np.uint8)
    colors[:, 2] = 242
    colors[:, 3] = 255
    widths = np.full(PATH_COUNT, 3.2, dtype=np.float32)
    return positions, colors, widths


def _event_data():
    starts = np.zeros((EVENT_COUNT, 3), dtype=np.float32)
    ends = np.zeros((EVENT_COUNT, 3), dtype=np.float32)
    colors = np.zeros((EVENT_COUNT, 4), dtype=np.uint8)
    widths = np.zeros(EVENT_COUNT, dtype=np.float32)
    groups = EVENT_COUNT // EVENT_ROWS

    for i in range(EVENT_COUNT):
        row = i % EVENT_ROWS
        group = i // EVENT_ROWS
        base = group / float(groups - 1)
        phase = row / float(EVENT_ROWS - 1)
        x = 12.0 * base + 0.18 * np.sin(TAU * (0.23 * i + 0.17 * phase))
        starts[i] = (np.clip(x, 0.0, 12.0), row - 0.34, 0.0)
        ends[i] = (starts[i, 0], row + 0.34, 0.0)
        colors[i] = (100, 170 + 9 * row, 220, 230)
        widths[i] = 2.2 + 0.8 * (row % 3)
    return starts, ends, colors, widths


def _residual_data():
    t = np.linspace(0.0, 1.0, POINT_COUNT, dtype=np.float32)
    y = 0.55 * (_signal(t) - _lagged_signal(t)) + 0.12 * np.sin(TAU * (9.0 * t + 0.20))
    positions = np.column_stack((12.0 * t, y, np.zeros(POINT_COUNT))).astype(np.float32)

    mag = np.minimum(np.abs(y), 1.0)
    colors = np.empty((POINT_COUNT, 4), dtype=np.uint8)
    colors[:, 0] = (110.0 + 65.0 * mag).astype(np.uint8)
    colors[:, 1] = (170.0 + 52.0 * (1.0 - mag)).astype(np.uint8)
    colors[:, 2] = 216
    colors[:, 3] = 238
    diameters = (4.0 + 5.0 * mag).astype(np.float32)
    return positions, colors, diameters


def _phase_data():
    t = np.linspace(0.0, 1.0, PHASE_COUNT, dtype=np.float32)
    positions = np.column_stack((_signal(t), _lagged_signal(t), np.zeros(PHASE_COUNT))).astype(
        np.float32
    )
    colors = np.empty((PHASE_COUNT, 4), dtype=np.uint8)
    colors[:, 0] = (64.0 + 64.0 * t).astype(np.uint8)
    colors[:, 1] = 214
    colors[:, 2] = 205
    colors[:, 3] = 245
    widths = np.full(PHASE_COUNT, 2.4, dtype=np.float32)
    return positions, colors, widths


def _band_data(ymin: float, ymax: float):
    x0 = [3.10, 8.05]
    x1 = [3.76, 8.72]
    band_colors = [(72, 170, 205, 45), (128, 220, 185, 38)]
    positions = np.zeros((6 * BAND_COUNT, 3), dtype=np.float32)
    colors = np.zeros((6 * BAND_COUNT, 4), dtype=np.uint8)
    for b in range(BAND_COUNT):
        k = 6 * b
        positions[k : k + 6] = [
            [x0[b], ymin, -0.02],
            [x1[b], ymin, -0.02],
            [x1[b], ymax, -0.02],
            [x0[b], ymin, -0.02],
            [x1[b], ymax, -0.02],
            [x0[b], ymax, -0.02],
        ]
        colors[k : k + 6] = band_colors[b]
    return positions, colors


def _cursor_data(ymin: float, ymax: float):
    xs = [3.43, 8.38]
    line_colors = [(100, 220, 245, 185), (150, 240, 205, 175)]
    starts = np.zeros((CURSOR_COUNT, 3), dtype=np.float32)
    ends = np.zeros((CURSOR_COUNT, 3), dtype=np.float32)
    colors = np.zeros((CURSOR_COUNT, 4), dtype=np.uint8)
    widths = np.full(CURSOR_COUNT, 2.2, dtype=np.float32)
    for i, x in enumerate(xs):
        starts[i] = (x, ymin, 0.0)
        ends[i] = (x, ymax, 0.0)
        colors[i] = line_colors[i]
    return starts, ends, colors, widths


def _set_domains(panel, x0: float, x1: float, y0: float, y1: float) -> None:
    if dvz.dvz_panel_set_domain(panel, dvz.DVZ_DIM_X, x0, x1) != 0:
        raise RuntimeError("dvz_panel_set_domain(X) failed")
    if dvz.dvz_panel_set_domain(panel, dvz.DVZ_DIM_Y, y0, y1) != 0:
        raise RuntimeError("dvz_panel_set_domain(Y) failed")


def _configure_panel(panel) -> None:
    dvz.dvz_panel_set_background_color(panel, ex.BG)
    border = dvz.dvz_panel_border_desc()
    border.visible = True
    border.color = dvz.DvzColor(ex.BLUE.r, ex.BLUE.g, ex.BLUE.b, 220)
    border.width_px = 2.25
    border.inset_px = 1.125
    if dvz.dvz_panel_set_border(panel, ctypes.byref(border)) != 0:
        raise RuntimeError("dvz_panel_set_border() failed")


def _add_axes(panel, x_label: bytes | None, y_label: bytes) -> None:
    x_axis = dvz.dvz_panel_axis(panel, dvz.DVZ_DIM_X)
    y_axis = dvz.dvz_panel_axis(panel, dvz.DVZ_DIM_Y)
    if not x_axis or not y_axis:
        raise RuntimeError("dvz_panel_axis() failed")

    ticks = dvz.dvz_axis_tick_policy()
    ticks.target_count = 6
    ticks.min_pixel_spacing = 96.0
    ticks.minor_per_interval = 3
    for axis in (x_axis, y_axis):
        if dvz.dvz_axis_set_tick_policy(axis, ctypes.byref(ticks)) != 0:
            raise RuntimeError("dvz_axis_set_tick_policy() failed")

    for axis, vertical in ((x_axis, False), (y_axis, True)):
        style = dvz.dvz_axis_style()
        style.tick_size_px = 11.0
        style.label_size_px = 14.0
        style.tick_gap_px = 7.0
        style.label_gap_px = 14.0 if vertical else 0.0
        style.grid_color[:] = (96, 165, 250, 145)
        style.spine_color[:] = (217, 226, 236, 210)
        style.major_tick_color[:] = (217, 226, 236, 230)
        style.minor_tick_color[:] = (217, 226, 236, 210)
        if dvz.dvz_axis_set_style(axis, ctypes.byref(style)) != 0:
            raise RuntimeError("dvz_axis_set_style() failed")
        if dvz.dvz_axis_set_grid(axis, True) != 0:
            raise RuntimeError("dvz_axis_set_grid() failed")

    if x_label is not None and dvz.dvz_axis_set_label(x_axis, x_label) != 0:
        raise RuntimeError("dvz_axis_set_label(X) failed")
    if dvz.dvz_axis_set_label(y_axis, y_label) != 0:
        raise RuntimeError("dvz_axis_set_label(Y) failed")


def _add_bands(scene, panel, ymin: float, ymax: float) -> None:
    positions, colors = _band_data(ymin, ymax)
    visual = dvz.dvz_primitive(scene, dvz.DVZ_PRIMITIVE_TOPOLOGY_TRIANGLE_LIST, 0)
    if not visual:
        raise RuntimeError("dvz_primitive() failed")
    if dvz.dvz_visual_set_data_many(visual, {"position": positions, "color": colors}) != 0:
        raise RuntimeError("dvz_visual_set_data_many(bands) failed")
    if dvz.dvz_visual_set_alpha_mode(visual, dvz.DVZ_ALPHA_BLENDED) != 0:
        raise RuntimeError("dvz_visual_set_alpha_mode(bands) failed")
    if dvz.dvz_visual_set_depth_test(visual, False) != 0:
        raise RuntimeError("dvz_visual_set_depth_test(bands) failed")
    ex.add_visual(panel, visual)


def _add_cursor_lines(scene, panel, ymin: float, ymax: float) -> None:
    starts, ends, colors, widths = _cursor_data(ymin, ymax)
    visual = dvz.dvz_segment(scene, 0)
    if not visual:
        raise RuntimeError("dvz_segment() failed")
    if dvz.dvz_visual_set_data_many(
        visual,
        {
            "position_start": starts,
            "position_end": ends,
            "color": colors,
            "stroke_width_px": widths,
        },
    ) != 0:
        raise RuntimeError("dvz_visual_set_data_many(cursor) failed")
    if dvz.dvz_segment_set_caps(visual, dvz.DVZ_SEGMENT_CAP_SQUARE, dvz.DVZ_SEGMENT_CAP_SQUARE) != 0:
        raise RuntimeError("dvz_segment_set_caps(cursor) failed")
    if dvz.dvz_visual_set_depth_test(visual, False) != 0:
        raise RuntimeError("dvz_visual_set_depth_test(cursor) failed")
    ex.add_visual(panel, visual)


def _add_path(scene, panel, positions, colors, widths) -> None:
    visual = dvz.dvz_path(scene, 0)
    if not visual:
        raise RuntimeError("dvz_path() failed")
    if dvz.dvz_visual_set_data_many(
        visual,
        {
            "position": positions,
            "color": colors,
            "stroke_width_px": widths,
        },
    ) != 0:
        raise RuntimeError("dvz_visual_set_data_many(path) failed")
    if dvz.dvz_path_set_caps(visual, dvz.DVZ_SEGMENT_CAP_ROUND, dvz.DVZ_SEGMENT_CAP_ROUND) != 0:
        raise RuntimeError("dvz_path_set_caps() failed")
    if dvz.dvz_path_set_join(visual, dvz.DVZ_PATH_JOIN_ROUND, 4.0) != 0:
        raise RuntimeError("dvz_path_set_join() failed")
    if dvz.dvz_visual_set_depth_test(visual, False) != 0:
        raise RuntimeError("dvz_visual_set_depth_test(path) failed")
    ex.add_visual(panel, visual)


def _add_event_panel(scene, panel) -> None:
    starts, ends, colors, widths = _event_data()
    visual = dvz.dvz_segment(scene, 0)
    if not visual:
        raise RuntimeError("dvz_segment() failed")
    if dvz.dvz_visual_set_data_many(
        visual,
        {
            "position_start": starts,
            "position_end": ends,
            "color": colors,
            "stroke_width_px": widths,
        },
    ) != 0:
        raise RuntimeError("dvz_visual_set_data_many(events) failed")
    if dvz.dvz_segment_set_caps(visual, dvz.DVZ_SEGMENT_CAP_SQUARE, dvz.DVZ_SEGMENT_CAP_SQUARE) != 0:
        raise RuntimeError("dvz_segment_set_caps(events) failed")
    if dvz.dvz_visual_set_depth_test(visual, False) != 0:
        raise RuntimeError("dvz_visual_set_depth_test(events) failed")
    ex.add_visual(panel, visual)


def _add_residual_panel(scene, panel) -> None:
    positions, colors, diameters = _residual_data()
    visual = dvz.dvz_point(scene, 0)
    if not visual:
        raise RuntimeError("dvz_point() failed")
    if dvz.dvz_visual_set_data_many(
        visual,
        {
            "position": positions,
            "color": colors,
            "diameter_px": diameters,
        },
    ) != 0:
        raise RuntimeError("dvz_visual_set_data_many(residuals) failed")
    style = dvz.dvz_point_style_desc()
    style.aspect = dvz.DVZ_SHAPE_ASPECT_FILLED
    if dvz.dvz_point_set_style(visual, ctypes.byref(style)) != 0:
        raise RuntimeError("dvz_point_set_style() failed")
    if dvz.dvz_visual_set_depth_test(visual, False) != 0:
        raise RuntimeError("dvz_visual_set_depth_test(residuals) failed")
    ex.add_visual(panel, visual)


def _build_scene():
    scene = dvz.dvz_scene()
    if not scene:
        raise RuntimeError("dvz_scene() failed")
    figure = dvz.dvz_figure(scene, ex.WIDTH, ex.HEIGHT, 0)
    if not figure:
        raise RuntimeError("dvz_figure() failed")
    grid = dvz.dvz_figure_grid(figure, 3, 2)
    if not grid:
        raise RuntimeError("dvz_figure_grid() failed")

    margins = dvz.DvzPanelReserve(36.0, 30.0, 24.0, 30.0)
    if dvz.dvz_grid_set_margins(grid, ctypes.byref(margins)) != 0:
        raise RuntimeError("dvz_grid_set_margins() failed")
    if dvz.dvz_grid_set_gutter(grid, 28.0, 26.0) != 0:
        raise RuntimeError("dvz_grid_set_gutter() failed")

    signal = dvz.dvz_grid_panel(grid, 0, 0)
    events = dvz.dvz_grid_panel(grid, 1, 0)
    residuals = dvz.dvz_grid_panel(grid, 2, 0)
    summary = dvz.dvz_grid_panel_span(grid, 0, 1, 3, 1)
    if not signal or not events or not residuals or not summary:
        raise RuntimeError("dvz_grid_panel() failed")

    for panel in (signal, events, residuals, summary):
        _configure_panel(panel)

    _set_domains(signal, 0.0, 12.0, -1.6, 1.6)
    _set_domains(events, 0.0, 12.0, -0.8, 7.8)
    _set_domains(residuals, 0.0, 12.0, -1.0, 1.0)
    _set_domains(summary, -1.45, 1.45, -1.45, 1.45)

    for panel, ymin, ymax in ((signal, -1.6, 1.6), (events, -0.8, 7.8), (residuals, -1.0, 1.0)):
        _add_bands(scene, panel, ymin, ymax)
    _add_path(scene, signal, *_signal_data())
    _add_event_panel(scene, events)
    _add_residual_panel(scene, residuals)
    _add_path(scene, summary, *_phase_data())
    for panel, ymin, ymax in ((signal, -1.6, 1.6), (events, -0.8, 7.8), (residuals, -1.0, 1.0)):
        _add_cursor_lines(scene, panel, ymin, ymax)

    _add_axes(signal, None, b"signal")
    _add_axes(events, None, b"events")
    _add_axes(residuals, b"time (s)", b"residual")
    _add_axes(summary, b"signal", b"lagged")
    return scene, figure, (signal, events, residuals), summary


def _configure_view(view, scene, left_panels, summary) -> None:
    first_x = None
    for panel in left_panels:
        x_controller, x_panzoom = ex.bind_panzoom(view, scene, panel, dvz.DVZ_DIM_MASK_X)
        _, y_panzoom = ex.bind_panzoom(view, scene, panel, dvz.DVZ_DIM_MASK_Y)
        if not dvz.dvz_panzoom_zoom_limits(
            y_panzoom, (ctypes.c_float * 2)(1.0, 1.0), (ctypes.c_float * 2)(1.0, 1.0)
        ):
            raise RuntimeError("dvz_panzoom_zoom_limits() failed")
        if first_x is None:
            first_x = x_controller
            if dvz.dvz_panzoom_zoom(x_panzoom, (ctypes.c_float * 2)(1.36, 1.0)) != 0:
                raise RuntimeError("dvz_panzoom_zoom(left X) failed")
        else:
            link = dvz.dvz_controller_link(
                scene,
                first_x,
                x_controller,
                dvz.DVZ_CONTROLLER_LINK_EXTENT_X,
                dvz.DVZ_CONTROLLER_LINK_TWO_WAY,
            )
            if not link:
                raise RuntimeError("dvz_controller_link() failed")
    ex.bind_panzoom(view, scene, summary, dvz.DVZ_DIM_MASK_XY)


def main() -> None:
    scene, figure, left_panels, summary = _build_scene()

    def configure(view) -> None:
        _configure_view(view, scene, left_panels, summary)

    ex.run_with_view(scene, figure, "Linked Panels With Axes", configure)


if __name__ == "__main__":
    main()
/*
 * Copyright (c) 2021 Cyrille Rossant and contributors. All rights reserved.
 * Licensed under the MIT license. See LICENSE file in the project root for details.
 * SPDX-License-Identifier: MIT
 */

/* panel_linked_axes - This example builds linked time-series panels with shared axes behavior.
 *
 * What to look for: the left column combines a synthetic signal trace, an event-raster panel, and
 * residual points, while the right panel summarizes the same time range. The important arrays are
 * the path samples, event segments, residual points, shaded bands, and cursor lines; compare the
 * panels to see that they use different y domains while their x navigation remains linked.
 *
 * This workflow is useful for scientific dashboards where traces, events, and summary statistics
 * must stay aligned during panzoom interaction.
 *
 * Scenario: showcases_panel_linked_axes
 * Style: showcase workflow, graphite_cyan, 1280x720 window target
 *
 * Build:  just example-c showcases/panel_linked_axes
 * Run:    ./build/examples/c/showcases/panel_linked_axes --live
 */


/*************************************************************************************************/
/*  Includes                                                                                     */
/*************************************************************************************************/

#include <math.h>
#include <stdbool.h>
#include <stdint.h>

#include "_alloc.h"
#include "_assertions.h"
#include "datoviz/scene.h"
#include "example_common.h"
#include "example_style.h"
#include "runner/scenario_runner.h"


/*************************************************************************************************/
/*  Forward declarations                                                                         */
/*************************************************************************************************/

DvzScenarioSpec dvz_showcase_linked_panel_axes_scenario(void);


/*************************************************************************************************/
/*  Constants                                                                                    */
/*************************************************************************************************/

#define WIDTH  EXAMPLE_WINDOW_WIDTH
#define HEIGHT EXAMPLE_WINDOW_HEIGHT
#define PATH_COUNT        360u
#define EVENT_COUNT       96u
#define EVENT_ROWS        8u
#define POINT_COUNT       168u
#define PHASE_COUNT       360u
#define BAND_COUNT        2u
#define BAND_VERTEX_COUNT (6u * BAND_COUNT)
#define CURSOR_COUNT      BAND_COUNT

static const float TAU = 6.28318530718f;


/*************************************************************************************************/
/*  Structs                                                                                      */
/*************************************************************************************************/

typedef struct LinkedAxesState
{
    DvzPanzoom* left_x[3];
    uint32_t left_x_count;
} LinkedAxesState;

#define LINKED_AXES_CHECK(condition, message)                                                    \
    do                                                                                            \
    {                                                                                             \
        if (!(condition))                                                                         \
        {                                                                                         \
            dvz_fprintf(stderr, "%s\n", message);                                                \
            return false;                                                                         \
        }                                                                                         \
    } while (0)


/*************************************************************************************************/
/*  Helpers                                                                                      */
/*************************************************************************************************/

/**
 * Return the deterministic signal used across panels.
 *
 * @param t normalized time in [0, 1]
 * @return signal value
 */
static float _signal(float t)
{
    return 0.85f * sinf(TAU * (1.08f * t + 0.06f)) +
           0.34f * sinf(TAU * (3.20f * t + 0.18f)) +
           0.12f * cosf(TAU * (6.00f * t + 0.10f));
}


/**
 * Return the deterministic secondary signal used for summaries.
 *
 * @param t normalized time in [0, 1]
 * @return secondary signal value
 */
static float _lagged_signal(float t)
{
    return 0.76f * sinf(TAU * (1.08f * t - 0.09f)) +
           0.30f * sinf(TAU * (2.50f * t + 0.32f));
}


/**
 * Fill deterministic signal path data in data coordinates.
 *
 * @param positions output data-space path positions
 * @param colors output path colors
 * @param widths output path stroke widths
 * @param count sample count
 */
static void _fill_signal(vec3* positions, DvzColor* colors, float* widths, uint32_t count)
{
    ANN(positions);
    ANN(colors);
    ANN(widths);

    const float inv_count = count > 1 ? 1.0f / (float)(count - 1u) : 1.0f;
    for (uint32_t i = 0; i < count; i++)
    {
        const float t = (float)i * inv_count;
        positions[i][0] = 12.0f * t;
        positions[i][1] = _signal(t);
        positions[i][2] = 0.0f;

        colors[i] = dvz_color_rgba(72, (uint8_t)(188.0f + 44.0f * t), 242, 255);
        widths[i] = 3.2f;
    }
}


/**
 * Fill event raster segments in data coordinates.
 *
 * @param starts output segment starts
 * @param ends output segment ends
 * @param colors output segment colors
 * @param widths output segment widths
 * @param count event count
 */
static void _fill_events(
    vec3* starts, vec3* ends, DvzColor* colors, float* widths, uint32_t count)
{
    ANN(starts);
    ANN(ends);
    ANN(colors);
    ANN(widths);

    for (uint32_t i = 0; i < count; i++)
    {
        const uint32_t row = i % EVENT_ROWS;
        const uint32_t group = i / EVENT_ROWS;
        const float base = (float)group / (float)((count / EVENT_ROWS) - 1u);
        const float phase = (float)row / (float)(EVENT_ROWS - 1u);
        const float x = 12.0f * base + 0.18f * sinf(TAU * (0.23f * (float)i + 0.17f * phase));
        const float y0 = (float)row - 0.34f;
        const float y1 = (float)row + 0.34f;

        starts[i][0] = fminf(fmaxf(x, 0.0f), 12.0f);
        starts[i][1] = y0;
        starts[i][2] = 0.0f;
        ends[i][0] = starts[i][0];
        ends[i][1] = y1;
        ends[i][2] = 0.0f;

        colors[i] = dvz_color_rgba(100, (uint8_t)(170u + 9u * row), 220, 230);
        widths[i] = 2.2f + 0.8f * (float)(row % 3u);
    }
}


/**
 * Fill deterministic residual point data in data coordinates.
 *
 * @param positions output data-space point positions
 * @param colors output point colors
 * @param diameters output point diameters
 * @param count point count
 */
static void _fill_residuals(vec3* positions, DvzColor* colors, float* diameters, uint32_t count)
{
    ANN(positions);
    ANN(colors);
    ANN(diameters);

    const float inv_count = count > 1 ? 1.0f / (float)(count - 1u) : 1.0f;
    for (uint32_t i = 0; i < count; i++)
    {
        const float t = (float)i * inv_count;
        const float x = 12.0f * t;
        const float y = 0.55f * (_signal(t) - _lagged_signal(t)) +
                        0.12f * sinf(TAU * (9.0f * t + 0.20f));

        positions[i][0] = x;
        positions[i][1] = y;
        positions[i][2] = 0.0f;

        const float mag = fminf(fabsf(y), 1.0f);
        colors[i] = dvz_color_rgba(
            (uint8_t)(110.0f + 65.0f * mag), (uint8_t)(170.0f + 52.0f * (1.0f - mag)),
            216, 238);
        diameters[i] = 4.0f + 5.0f * mag;
    }
}


/**
 * Fill phase portrait data in the right-side summary panel.
 *
 * @param positions output data-space path positions
 * @param colors output path colors
 * @param widths output path stroke widths
 * @param count sample count
 */
static void _fill_phase(vec3* positions, DvzColor* colors, float* widths, uint32_t count)
{
    ANN(positions);
    ANN(colors);
    ANN(widths);

    const float inv_count = count > 1 ? 1.0f / (float)(count - 1u) : 1.0f;
    for (uint32_t i = 0; i < count; i++)
    {
        const float t = (float)i * inv_count;
        positions[i][0] = _signal(t);
        positions[i][1] = _lagged_signal(t);
        positions[i][2] = 0.0f;

        colors[i] = dvz_color_rgba((uint8_t)(64.0f + 64.0f * t), 214, 205, 245);
        widths[i] = 2.4f;
    }
}


/**
 * Fill synchronized X bands in one panel's data coordinates.
 *
 * @param ymin panel data-domain minimum
 * @param ymax panel data-domain maximum
 * @param positions output band triangle positions
 * @param colors output band colors
 */
static void _fill_bands(double ymin, double ymax, vec3* positions, DvzColor* colors)
{
    ANN(positions);
    ANN(colors);

    const float x0[BAND_COUNT] = {3.10f, 8.05f};
    const float x1[BAND_COUNT] = {3.76f, 8.72f};
    const DvzColor band_colors[BAND_COUNT] = {
        {72, 170, 205, 45},
        {128, 220, 185, 38},
    };

    for (uint32_t b = 0; b < BAND_COUNT; b++)
    {
        const uint32_t k = 6u * b;
        positions[k + 0][0] = x0[b];
        positions[k + 0][1] = (float)ymin;
        positions[k + 1][0] = x1[b];
        positions[k + 1][1] = (float)ymin;
        positions[k + 2][0] = x1[b];
        positions[k + 2][1] = (float)ymax;
        positions[k + 3][0] = x0[b];
        positions[k + 3][1] = (float)ymin;
        positions[k + 4][0] = x1[b];
        positions[k + 4][1] = (float)ymax;
        positions[k + 5][0] = x0[b];
        positions[k + 5][1] = (float)ymax;
        for (uint32_t j = 0; j < 6u; j++)
        {
            positions[k + j][2] = -0.02f;
            colors[k + j] = band_colors[b];
        }
    }
}


/**
 * Fill fixed-pixel-width cursor lines in one panel's data coordinates.
 *
 * @param ymin panel data-domain minimum
 * @param ymax panel data-domain maximum
 * @param starts output cursor segment starts
 * @param ends output cursor segment ends
 * @param colors output cursor colors
 * @param widths output cursor line widths
 */
static void _fill_cursor_lines(
    double ymin, double ymax, vec3* starts, vec3* ends, DvzColor* colors, float* widths)
{
    ANN(starts);
    ANN(ends);
    ANN(colors);
    ANN(widths);

    const float x[CURSOR_COUNT] = {3.43f, 8.38f};
    const DvzColor line_colors[CURSOR_COUNT] = {
        {100, 220, 245, 185},
        {150, 240, 205, 175},
    };

    for (uint32_t i = 0; i < CURSOR_COUNT; i++)
    {
        starts[i][0] = x[i];
        starts[i][1] = (float)ymin;
        starts[i][2] = 0.0f;
        ends[i][0] = x[i];
        ends[i][1] = (float)ymax;
        ends[i][2] = 0.0f;
        colors[i] = line_colors[i];
        widths[i] = 2.2f;
    }
}


/**
 * Configure retained X/Y axes on one panel.
 *
 * @param panel target panel
 * @param x_label X axis label
 * @param y_label Y axis label
 * @return true when all axis calls succeed
 */
static bool _add_axes(DvzPanel* panel, const char* x_label, const char* y_label)
{
    ANN(panel);
    ANN(y_label);

    DvzAxis* x_axis = dvz_panel_axis(panel, DVZ_DIM_X);
    DvzAxis* y_axis = dvz_panel_axis(panel, DVZ_DIM_Y);
    if (x_axis == NULL || y_axis == NULL)
        return false;

    DvzAxisTickPolicy ticks = dvz_axis_tick_policy();
    ticks.target_count = 6;
    ticks.min_pixel_spacing = 96.0f;
    ticks.minor_per_interval = 3;
    if (dvz_axis_set_tick_policy(x_axis, &ticks) != DVZ_OK)
        return false;
    if (dvz_axis_set_tick_policy(y_axis, &ticks) != DVZ_OK)
        return false;
    ExampleAxisStyleOptions style = example_graphite_cyan_axis_options();
    style.tick_size_px = 11.0f;
    style.label_size_px = 14.0f;
    style.tick_gap_px = 7.0f;
    style.x_label_gap_px = 0.0f;
    style.y_label_gap_px = 14.0f;
    style.minor_tick_alpha = 210;
    style.grid_alpha = 145;
    if (!example_graphite_cyan_apply_axis_style(x_axis, false, &style) ||
        !example_graphite_cyan_apply_axis_style(y_axis, true, &style))
        return false;
    if (dvz_axis_set_grid(x_axis, true) != DVZ_OK || dvz_axis_set_grid(y_axis, true) != DVZ_OK)
        return false;
    if (x_label != NULL && dvz_axis_set_label(x_axis, x_label) != DVZ_OK)
        return false;
    return dvz_axis_set_label(y_axis, y_label) == DVZ_OK;
}


/**
 * Add synchronized reference bands clipped to one panel.
 *
 * @param scene scene owning the visual
 * @param panel panel receiving the visual
 * @param ymin panel data-domain minimum
 * @param ymax panel data-domain maximum
 * @return true when the bands were added
 */
static bool _add_bands(DvzScene* scene, DvzPanel* panel, double ymin, double ymax)
{
    ANN(scene);
    ANN(panel);

    vec3 data_positions[BAND_VERTEX_COUNT] = {{0}};
    DvzColor colors[BAND_VERTEX_COUNT] = {{0}};
    _fill_bands(ymin, ymax, data_positions, colors);

    DvzVisual* visual = dvz_primitive(scene, DVZ_PRIMITIVE_TOPOLOGY_TRIANGLE_LIST, 0);
    if (visual == NULL)
        return false;
    if (dvz_visual_set_data(visual, "position", data_positions, BAND_VERTEX_COUNT) != 0)
        return false;
    if (dvz_visual_set_data(visual, "color", colors, BAND_VERTEX_COUNT) != 0)
        return false;
    if (dvz_visual_set_alpha_mode(visual, DVZ_ALPHA_BLENDED) != 0)
        return false;
    if (dvz_visual_set_depth_test(visual, false) != 0)
        return false;
    return dvz_panel_add_visual(panel, visual, NULL) == 0;
}


/**
 * Add synchronized fixed-width cursor lines clipped to one panel.
 *
 * @param scene scene owning the visual
 * @param panel panel receiving the visual
 * @param ymin panel data-domain minimum
 * @param ymax panel data-domain maximum
 * @return true when the cursor lines were added
 */
static bool _add_cursor_lines(DvzScene* scene, DvzPanel* panel, double ymin, double ymax)
{
    ANN(scene);
    ANN(panel);

    vec3 starts[CURSOR_COUNT] = {{0}};
    vec3 ends[CURSOR_COUNT] = {{0}};
    DvzColor colors[CURSOR_COUNT] = {{0}};
    float widths[CURSOR_COUNT] = {0};
    _fill_cursor_lines(ymin, ymax, starts, ends, colors, widths);

    DvzVisual* visual = dvz_segment(scene, 0);
    if (visual == NULL)
        return false;
    DvzVisualDataUpdate updates[] = {
        {.attr_name = "position_start", .data = starts, .item_count = CURSOR_COUNT},
        {.attr_name = "position_end", .data = ends, .item_count = CURSOR_COUNT},
        {.attr_name = "color", .data = colors, .item_count = CURSOR_COUNT},
        {.attr_name = "stroke_width_px", .data = widths, .item_count = CURSOR_COUNT},
    };
    if (dvz_visual_set_data_many(visual, updates, 4) != 0)
        return false;
    if (dvz_segment_set_caps(visual, DVZ_SEGMENT_CAP_SQUARE, DVZ_SEGMENT_CAP_SQUARE) != 0)
        return false;
    if (dvz_visual_set_depth_test(visual, false) != 0)
        return false;
    return dvz_panel_add_visual(panel, visual, NULL) == 0;
}


/**
 * Add a stroked path visual to one panel.
 *
 * @param scene scene owning the visual
 * @param panel panel receiving the visual
 * @param positions data-space path positions
 * @param colors path colors
 * @param widths path stroke widths
 * @param count sample count
 * @return true when the visual was added
 */
static bool _add_path(
    DvzScene* scene, DvzPanel* panel, vec3* positions, DvzColor* colors, float* widths,
    uint32_t count)
{
    ANN(scene);
    ANN(panel);
    ANN(positions);
    ANN(colors);
    ANN(widths);

    DvzVisual* visual = dvz_path(scene, 0);
    if (visual == NULL)
        return false;

    DvzVisualDataUpdate updates[] = {
        {.attr_name = "position", .data = positions, .item_count = count},
        {.attr_name = "color", .data = colors, .item_count = count},
        {.attr_name = "stroke_width_px", .data = widths, .item_count = count},
    };
    if (dvz_visual_set_data_many(visual, updates, 3) != 0)
        return false;
    if (dvz_path_set_caps(visual, DVZ_SEGMENT_CAP_ROUND, DVZ_SEGMENT_CAP_ROUND) != 0)
        return false;
    if (dvz_path_set_join(visual, DVZ_PATH_JOIN_ROUND, 4.0f) != 0)
        return false;
    if (dvz_visual_set_depth_test(visual, false) != 0)
        return false;
    return dvz_panel_add_visual(panel, visual, NULL) == 0;
}


/**
 * Add the top signal path panel.
 *
 * @param scene scene owning the visual
 * @param panel panel receiving the visual
 * @return true when the visual was added
 */
static bool _add_signal_panel(DvzScene* scene, DvzPanel* panel)
{
    ANN(scene);
    ANN(panel);

    vec3 positions[PATH_COUNT] = {{0}};
    DvzColor colors[PATH_COUNT] = {{0}};
    float widths[PATH_COUNT] = {0};
    _fill_signal(positions, colors, widths, PATH_COUNT);
    return _add_path(scene, panel, positions, colors, widths, PATH_COUNT);
}


/**
 * Add the middle event raster panel.
 *
 * @param scene scene owning the visual
 * @param panel panel receiving the visual
 * @return true when the visual was added
 */
static bool _add_event_panel(DvzScene* scene, DvzPanel* panel)
{
    ANN(scene);
    ANN(panel);

    vec3 starts[EVENT_COUNT] = {{0}};
    vec3 ends[EVENT_COUNT] = {{0}};
    DvzColor colors[EVENT_COUNT] = {{0}};
    float widths[EVENT_COUNT] = {0};
    _fill_events(starts, ends, colors, widths, EVENT_COUNT);

    DvzVisual* visual = dvz_segment(scene, 0);
    if (visual == NULL)
        return false;

    DvzVisualDataUpdate updates[] = {
        {.attr_name = "position_start", .data = starts, .item_count = EVENT_COUNT},
        {.attr_name = "position_end", .data = ends, .item_count = EVENT_COUNT},
        {.attr_name = "color", .data = colors, .item_count = EVENT_COUNT},
        {.attr_name = "stroke_width_px", .data = widths, .item_count = EVENT_COUNT},
    };
    if (dvz_visual_set_data_many(visual, updates, 4) != 0)
        return false;
    if (dvz_segment_set_caps(visual, DVZ_SEGMENT_CAP_SQUARE, DVZ_SEGMENT_CAP_SQUARE) != 0)
        return false;
    if (dvz_visual_set_depth_test(visual, false) != 0)
        return false;
    return dvz_panel_add_visual(panel, visual, NULL) == 0;
}


/**
 * Add the bottom residual point panel.
 *
 * @param scene scene owning the visual
 * @param panel panel receiving the visual
 * @return true when the visual was added
 */
static bool _add_residual_panel(DvzScene* scene, DvzPanel* panel)
{
    ANN(scene);
    ANN(panel);

    vec3 data_positions[POINT_COUNT] = {{0}};
    DvzColor colors[POINT_COUNT] = {{0}};
    float diameters[POINT_COUNT] = {0};
    _fill_residuals(data_positions, colors, diameters, POINT_COUNT);

    DvzVisual* visual = dvz_point(scene, 0);
    if (visual == NULL)
        return false;

    DvzVisualDataUpdate updates[] = {
        {.attr_name = "position", .data = data_positions, .item_count = POINT_COUNT},
        {.attr_name = "color", .data = colors, .item_count = POINT_COUNT},
        {.attr_name = "diameter_px", .data = diameters, .item_count = POINT_COUNT},
    };
    if (dvz_visual_set_data_many(visual, updates, 3) != 0)
        return false;

    DvzPointStyleDesc style = dvz_point_style_desc();
    style.aspect = DVZ_SHAPE_ASPECT_FILLED;
    if (dvz_point_set_style(visual, &style) != 0)
        return false;
    if (dvz_visual_set_depth_test(visual, false) != 0)
        return false;
    return dvz_panel_add_visual(panel, visual, NULL) == 0;
}


/**
 * Add the right-side phase summary panel.
 *
 * @param scene scene owning the visual
 * @param panel panel receiving the visual
 * @return true when the visual was added
 */
static bool _add_summary_panel(DvzScene* scene, DvzPanel* panel)
{
    ANN(scene);
    ANN(panel);

    vec3 positions[PHASE_COUNT] = {{0}};
    DvzColor colors[PHASE_COUNT] = {{0}};
    float widths[PHASE_COUNT] = {0};
    _fill_phase(positions, colors, widths, PHASE_COUNT);
    return _add_path(scene, panel, positions, colors, widths, PHASE_COUNT);
}


/**
 * Bind linked X panzooms and independent Y/summary panzooms.
 *
 * @param ctx scenario context
 * @param left left-column panels
 * @param left_count number of left-column panels
 * @param summary right summary panel
 * @return true when controllers and input routing are ready
 */
static bool _bind_linked_panzooms(
    DvzScenarioContext* ctx,
    DvzPanel** left,
    uint32_t left_count,
    DvzPanel* summary,
    LinkedAxesState* state)
{
    ANN(ctx);
    ANN(left);
    ANN(summary);

    DvzController* summary_xy = dvz_panzoom(ctx->scene, NULL);
    if (summary_xy == NULL)
        return false;

    DvzController* first_x = NULL;
    for (uint32_t i = 0; i < left_count; i++)
    {
        DvzController* x = dvz_panzoom(ctx->scene, NULL);
        DvzController* y = dvz_panzoom(ctx->scene, NULL);
        if (left[i] == NULL || x == NULL || y == NULL)
            return false;
        DvzPanzoom* x_panzoom = dvz_controller_panzoom(x);
        DvzPanzoom* y_panzoom = dvz_controller_panzoom(y);
        if (
            x_panzoom == NULL || y_panzoom == NULL ||
            !dvz_panzoom_zoom_limits(y_panzoom, (vec2){1.0f, 1.0f}, (vec2){1.0f, 1.0f}))
        {
            return false;
        }
        if (state != NULL && state->left_x_count < DVZ_ARRAY_COUNT(state->left_x))
            state->left_x[state->left_x_count++] = x_panzoom;
        if (dvz_scenario_bind_controller(ctx, left[i], x, DVZ_DIM_MASK_X) != 0)
            return false;
        if (dvz_scenario_bind_controller(ctx, left[i], y, DVZ_DIM_MASK_Y) != 0)
            return false;
        if (first_x == NULL)
        {
            first_x = x;
        }
        else if (
            dvz_controller_link(
                ctx->scene, first_x, x, DVZ_CONTROLLER_LINK_EXTENT_X,
                DVZ_CONTROLLER_LINK_TWO_WAY) == NULL)
        {
            return false;
        }
    }
    return dvz_scenario_bind_controller(ctx, summary, summary_xy, DVZ_DIM_MASK_XY) == 0;
}


/**
 * Set one panel domain with checked return values.
 *
 * @param panel target panel
 * @param x0 X minimum
 * @param x1 X maximum
 * @param y0 Y minimum
 * @param y1 Y maximum
 * @return true when both domains were set
 */
static bool _set_domains(DvzPanel* panel, double x0, double x1, double y0, double y1)
{
    ANN(panel);

    int rc = dvz_panel_set_domain(panel, DVZ_DIM_X, x0, x1);
    if (rc != 0)
        return false;
    rc = dvz_panel_set_domain(panel, DVZ_DIM_Y, y0, y1);
    return rc == 0;
}


/**
 * Add a subtle fixed border around one panel.
 *
 * @param panel target panel
 * @return true when the border was configured
 */
static bool _set_panel_border(DvzPanel* panel)
{
    ANN(panel);

    DvzColor color = example_graphite_cyan_color(EXAMPLE_STYLE_COLOR_GRID);
    color.a = 220u;
    DvzPanelBorderDesc border = dvz_panel_border_desc();
    border.color = color;
    border.width_px = 2.25f;
    border.inset_px = 1.125f;
    return dvz_panel_set_border(panel, &border) == DVZ_OK;
}


/**
 * Configure one panel's background and border.
 *
 * @param panel target panel
 * @return true when layout was configured
 */
static bool _configure_panel(DvzPanel* panel)
{
    ANN(panel);

    example_graphite_cyan_set_panel_background(panel);
    return _set_panel_border(panel);
}


/**
 * Initialize the linked-panel axes scenario.
 *
 * @param ctx scenario context
 * @param out_user scenario state output
 * @return whether setup succeeded
 */
static bool _scenario_init(DvzScenarioContext* ctx, void** out_user)
{
    ANN(ctx);
    ANN(ctx->scene);
    if (out_user != NULL)
        *out_user = NULL;

    ctx->figure = dvz_figure(ctx->scene, ctx->width, ctx->height, 0);
    LINKED_AXES_CHECK(ctx->figure != NULL, "dvz_figure() failed");
    DvzGrid* grid = dvz_figure_grid(ctx->figure, 3, 2);
    LINKED_AXES_CHECK(grid != NULL, "dvz_figure_grid() failed");
    bool ok = dvz_grid_set_margins(
                  grid, &(DvzPanelReserve){.left_px = 36.0f, .right_px = 30.0f,
                                           .top_px = 24.0f, .bottom_px = 30.0f}) == DVZ_OK;
    LINKED_AXES_CHECK(ok, "dvz_grid_set_margins() failed");
    ok = dvz_grid_set_gutter(grid, 28.0f, 26.0f) == DVZ_OK;
    LINKED_AXES_CHECK(ok, "dvz_grid_set_gutter() failed");

    DvzPanel* signal = dvz_grid_panel(grid, 0, 0);
    DvzPanel* events = dvz_grid_panel(grid, 1, 0);
    DvzPanel* residuals = dvz_grid_panel(grid, 2, 0);
    DvzPanel* summary = dvz_grid_panel_span(grid, 0, 1, 3, 1);
    LINKED_AXES_CHECK(
        signal != NULL && events != NULL && residuals != NULL && summary != NULL,
        "dvz_grid_panel() failed");

    ok = _configure_panel(signal);
    LINKED_AXES_CHECK(ok, "_configure_panel(signal) failed");
    ok = _configure_panel(events);
    LINKED_AXES_CHECK(ok, "_configure_panel(events) failed");
    ok = _configure_panel(residuals);
    LINKED_AXES_CHECK(ok, "_configure_panel(residuals) failed");
    example_graphite_cyan_set_panel_background(summary);
    ok = _set_panel_border(summary);
    LINKED_AXES_CHECK(ok, "_set_panel_border(summary) failed");

    ok = _set_domains(signal, 0.0, 12.0, -1.6, 1.6);
    LINKED_AXES_CHECK(ok, "_set_domains(signal) failed");
    ok = _set_domains(events, 0.0, 12.0, -0.8, 7.8);
    LINKED_AXES_CHECK(ok, "_set_domains(events) failed");
    ok = _set_domains(residuals, 0.0, 12.0, -1.0, 1.0);
    LINKED_AXES_CHECK(ok, "_set_domains(residuals) failed");
    ok = _set_domains(summary, -1.45, 1.45, -1.45, 1.45);
    LINKED_AXES_CHECK(ok, "_set_domains(summary) failed");

    ok = _add_bands(ctx->scene, signal, -1.6, 1.6);
    LINKED_AXES_CHECK(ok, "_add_bands(signal) failed");
    ok = _add_bands(ctx->scene, events, -0.8, 7.8);
    LINKED_AXES_CHECK(ok, "_add_bands(events) failed");
    ok = _add_bands(ctx->scene, residuals, -1.0, 1.0);
    LINKED_AXES_CHECK(ok, "_add_bands(residuals) failed");
    ok = _add_signal_panel(ctx->scene, signal);
    LINKED_AXES_CHECK(ok, "_add_signal_panel() failed");
    ok = _add_event_panel(ctx->scene, events);
    LINKED_AXES_CHECK(ok, "_add_event_panel() failed");
    ok = _add_residual_panel(ctx->scene, residuals);
    LINKED_AXES_CHECK(ok, "_add_residual_panel() failed");
    ok = _add_summary_panel(ctx->scene, summary);
    LINKED_AXES_CHECK(ok, "_add_summary_panel() failed");
    ok = _add_cursor_lines(ctx->scene, signal, -1.6, 1.6);
    LINKED_AXES_CHECK(ok, "_add_cursor_lines(signal) failed");
    ok = _add_cursor_lines(ctx->scene, events, -0.8, 7.8);
    LINKED_AXES_CHECK(ok, "_add_cursor_lines(events) failed");
    ok = _add_cursor_lines(ctx->scene, residuals, -1.0, 1.0);
    LINKED_AXES_CHECK(ok, "_add_cursor_lines(residuals) failed");

    ok = _add_axes(signal, NULL, "signal");
    LINKED_AXES_CHECK(ok, "_add_axes(signal) failed");
    ok = _add_axes(events, NULL, "events");
    LINKED_AXES_CHECK(ok, "_add_axes(events) failed");
    ok = _add_axes(residuals, "time (s)", "residual");
    LINKED_AXES_CHECK(ok, "_add_axes(residuals) failed");
    ok = _add_axes(summary, "signal", "lagged");
    LINKED_AXES_CHECK(ok, "_add_axes(summary) failed");

    DvzPanel* left[] = {signal, events, residuals};
    LinkedAxesState* state = (LinkedAxesState*)dvz_calloc(1, sizeof(*state));
    LINKED_AXES_CHECK(state != NULL, "linked axes state allocation failed");
    ok = _bind_linked_panzooms(ctx, left, 3, summary, state);
    if (!ok)
    {
        dvz_free(state);
        return false;
    }
    if (out_user != NULL)
        *out_user = state;

    return true;
}


/**
 * Apply deterministic shared-X panning for generated gallery media.
 *
 * @param ctx scenario context
 * @param user scenario state
 */
static void _scenario_frame(DvzScenarioContext* ctx, void* user)
{
    LinkedAxesState* state = (LinkedAxesState*)user;
    if (ctx == NULL || !ctx->preview_mode || state == NULL)
        return;

    const uint64_t count = ctx->preview_frame_count > 0 ? ctx->preview_frame_count : 1;
    const float phase = (float)(ctx->preview_frame_index % count) / (float)count;
    const float theta = TAU * phase;
    vec2 pan = {0.26f * sinf(theta), 0.0f};
    vec2 zoom = {1.36f, 1.0f};
    for (uint32_t i = 0; i < state->left_x_count; i++)
    {
        if (state->left_x[i] == NULL)
            continue;
        dvz_panzoom_zoom(state->left_x[i], zoom);
        dvz_panzoom_pan(state->left_x[i], pan);
    }
}


/**
 * Destroy the linked axes scenario state.
 *
 * @param ctx scenario context
 * @param user scenario state
 */
static void _scenario_destroy(DvzScenarioContext* ctx, void* user)
{
    (void)ctx;
    dvz_free(user);
}


/**
 * Return the linked-panel axes scenario specification.
 *
 * @return scenario specification
 */
DvzScenarioSpec dvz_showcase_linked_panel_axes_scenario(void)
{
    return (DvzScenarioSpec){
        .id = "showcases_panel_linked_axes",
        .title = "Linked Panels With Axes",
        .width = WIDTH,
        .height = HEIGHT,
        .fps = 60.0,
        .requirements = DVZ_SCENARIO_REQ_POINT_VISUAL | DVZ_SCENARIO_REQ_TEXT_VISUAL |
                        DVZ_SCENARIO_REQ_CONTROLLER | DVZ_SCENARIO_REQ_PANZOOM |
                        DVZ_SCENARIO_REQ_FRAME_CALLBACKS,
        .init = _scenario_init,
        .frame = _scenario_frame,
        .destroy = _scenario_destroy,
    };
}


/*************************************************************************************************/
/*  Functions                                                                                    */
/*************************************************************************************************/

/**
 * Run the linked-panel axes and linked-X panzoom feature proof.
 *
 * @param argc command-line argument count
 * @param argv command-line argument vector
 * @return process exit code
 */
#ifndef DVZ_EXAMPLE_NO_MAIN
int main(int argc, char** argv)
{
    DvzScenarioSpec spec = dvz_showcase_linked_panel_axes_scenario();
    return dvz_scenario_run_native_cli(&spec, argc, argv) == 0 ? 0 : 1;
}
#endif

#undef LINKED_AXES_CHECK
Example details
- ID:
showcases_panel_linked_axes - Category:
showcase - Lane:
showcases - Status:
supported - Source:
examples/c/showcases/panel_linked_axes.c - Approved adaptation starter:
no - Python source:
examples/python/gallery/showcases/panel_linked_axes.py - Python adaptation: Available; direct-engine adaptation
- Browser support: Live in browser
- WebGPU live route:
examples/webgpu/live.html?id=showcases_panel_linked_axes - Browser capability tags:
panel-grid,linked-panels,axes,panzoom,path - Validation:
smoke+interaction+screenshot
Tags
workflow, linked-panels, axes, panzoom, synthetic
Data
| Field | Value |
|---|---|
kind |
synthetic |